Covid-19: Is NI in the toughest period of the pandemic?
 BBC
BBCMedics have been warning that we are now at the peak of the second wave of the coronavirus pandemic in Northern Ireland.
While the numbers and statistics used to measure the pandemic can never portray the suffering and individual cost of the virus, they do give us an insight into how we're coping with the outbreak.
In short, we are now going through the toughest period since Covid-19 became a part of our lives.
More people are in our hospitals suffering from the virus.
More people are dying with Covid.
And many non-Covid aspects of our healthcare system are being adversely affected by the huge strains the virus has placed on our medics and support staff.
It's not all doom and gloom though - there are indicators among figures which give reasons for hope.

Hospitals
Northern Ireland's hospitals have been under immense pressure in January because of coronavirus.
And while there are tentative signs that this is starting to abate slightly, the numbers of patients in our hospitals suffering from Covid are still huge.
In non-Covid years, Northern Ireland has a fairly predictable rate for occupancy of beds in hospitals - it's just less than 84%.
The daily occupancy rate given out by the Department of Health is a separate - but comparable - figure.
During the pandemic our hospitals have been routinely more than 90% full and sometimes more than 100% full, meaning we have more people in hospital than we have beds to put them in.
According to revised data from the Department of Health, at one point this month, there were just shy of 1,000 Covid-19 patients in hospital.
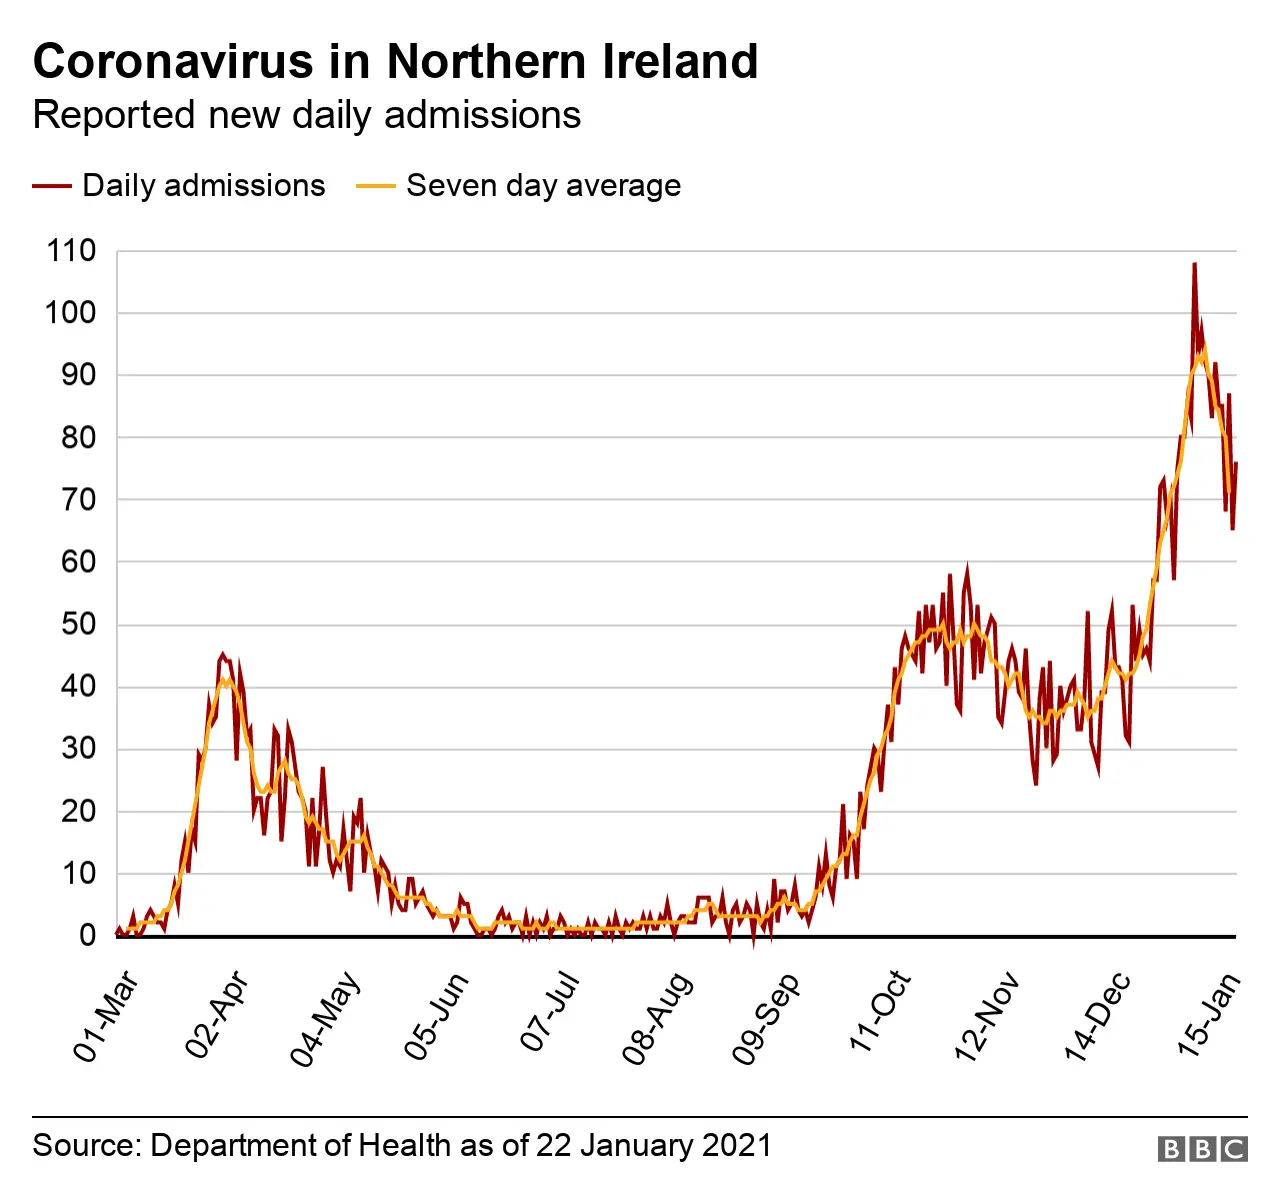
Let's put that number in context.
Across all of Northern Ireland's hospitals there are about 3,000 beds - meaning one in three of them was catering for a Covid patient.
According to data from the Department of Health the peak for hospitalisations in this second wave - indeed the entire pandemic - came on 13 January, when 997 Covid patients were in hospital in Northern Ireland.
The equivalent figure for the first wave is 354 on 8 April 2020.
So the peak this time around, at least in terms of hospitalisations, has been almost three times as bad.
But it's not just the sheer number of people in hospital that has been tougher this time around - the surge has been more intense, more sustained, and slower to fall.
For simplicity, let's take the figure of 200 inpatients as marking the start and finish of a surge.
That would mean that we entered the first wave's surge on 29 March, with it lasting until 18 May - about seven weeks, with a peak of 354.
By the same measure, the current surge began on 6 October, and now - more than 15 weeks later - we're still not out of it and there are more than 800 people currently in hospital with Covid-19.
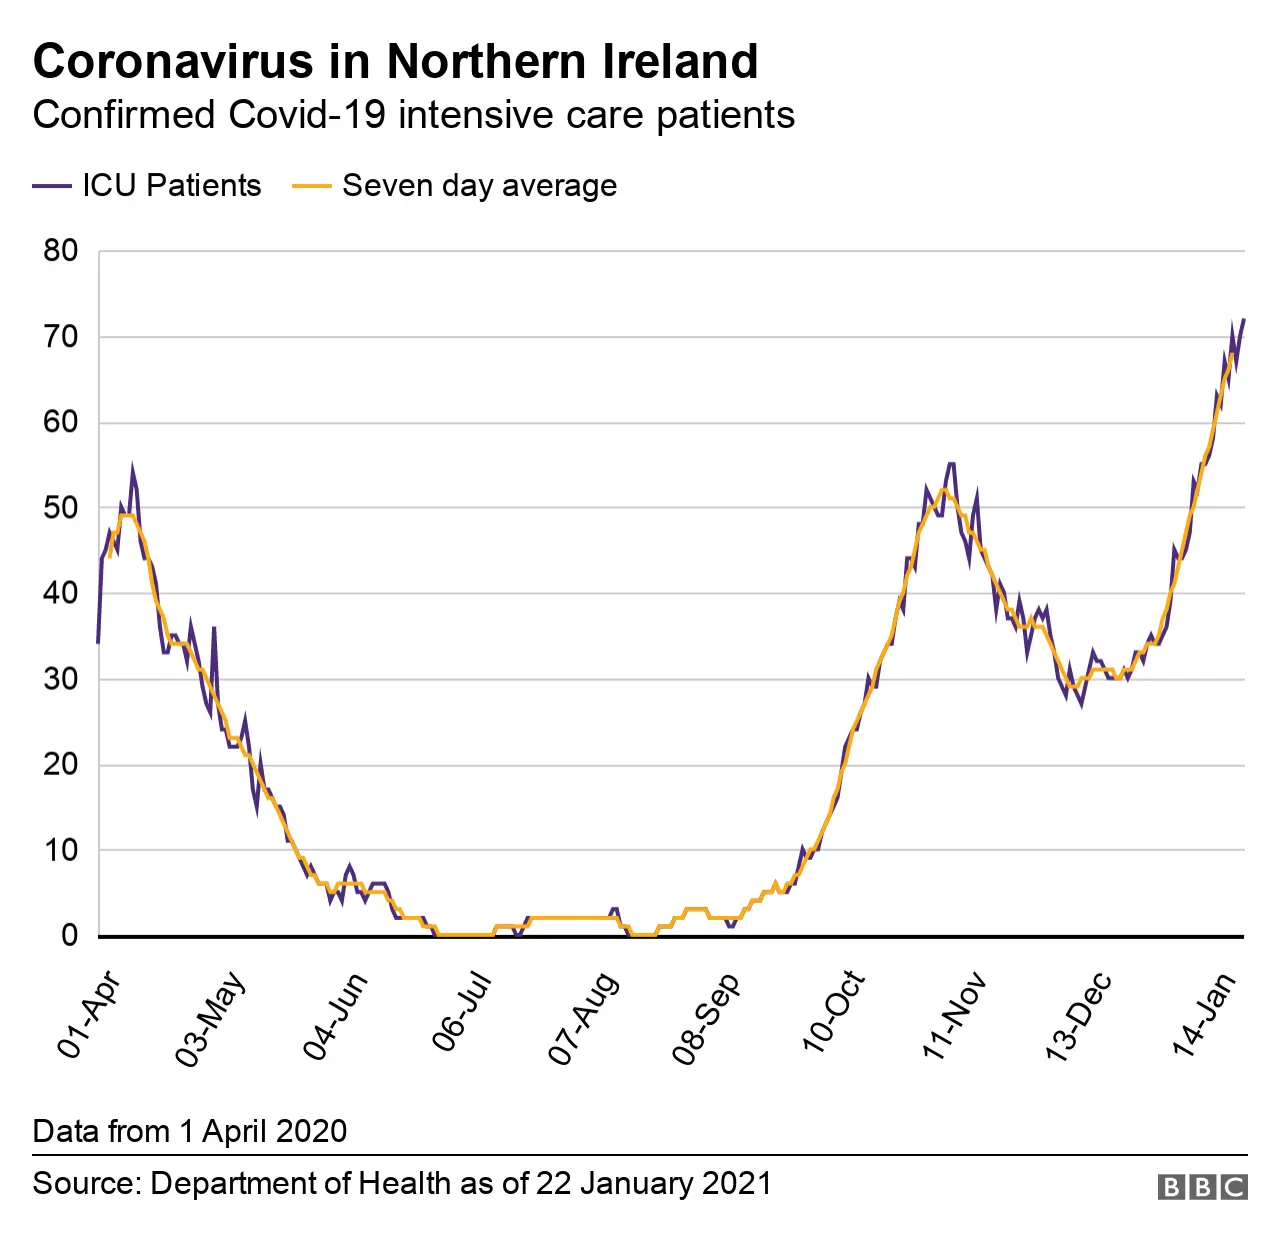
Intensive care units (ICUs) are coming under huge pressure - there are more people requiring admission to ICU than at any point in the pandemic to date.
A good way to measure trends - whether numbers are rising or falling - is to use a rolling average rather than a single day's figures.
The Department of Health publishes a five-day rolling average for the occupancy of ICU beds by Covid patients.
It indicates how many people might be expected to be in ICU on any given day, based on the average of a five-day window.
This rolling rate has been continually rising since Christmas Eve. It stood at 31 on 24 December - it's now 69.
More beds have been made available for intensive care so we do have added capacity.
But it should be remembered that this added capacity comes at a price as medics are diverted from their normal work and other services reduced.

Deaths
Looking at the Covid death rate for January, it has been a very bleak start to the year.
More people have been dying with Covid than at any other stage in the pandemic.
During the first wave, the daily death toll reported by the Department of Health - of people who die within 28 days of a positive Covid test - never went above 20.
But it has done so on five occasions in January, peaking at 29 deaths on 17 January.
There are early indications that this death rate is falling.
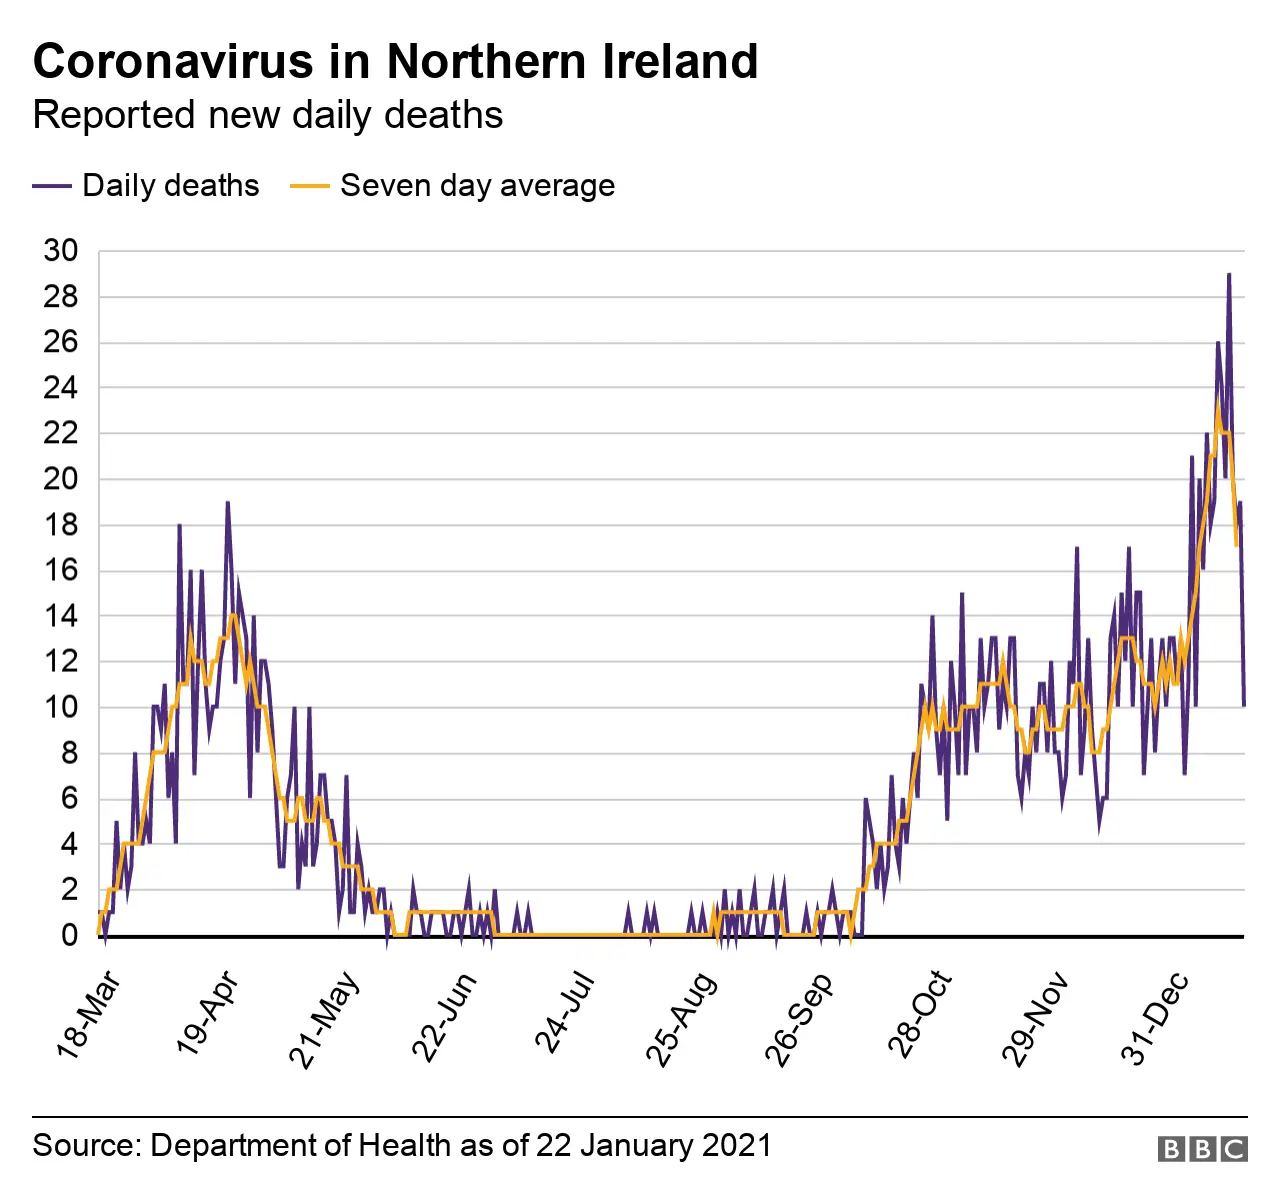
The department publishes a seven-day rolling average death rate.
Just like the rolling average for ICU beds mentioned above, it's useful when looking for trends - and it's now beginning to show a falling rate.
It's a positive but one that comes with a warning - these are very early days and it could well start to rise again.
Cumulatively, Northern Ireland's death rate has been the lowest of the four UK nations but higher than the Republic of Ireland's and this remains the case.
The Northern Ireland Statistics and Research Agency (Nisra) counts the number of death certificates which mention Covid-19.
The agency's figure for deaths over the course of the pandemic in Northern Ireland has now surpassed 2,000.

Infection rates
Infection rates measure the spread of the virus.
And in Northern Ireland they're falling - right across every council area.
Gone are the days when some of our council areas had some of the worst Covid infection rates in the UK.
The rates are still not good but compared to what they were - and compared to some of the infection rates in Britain - they are much, much better.
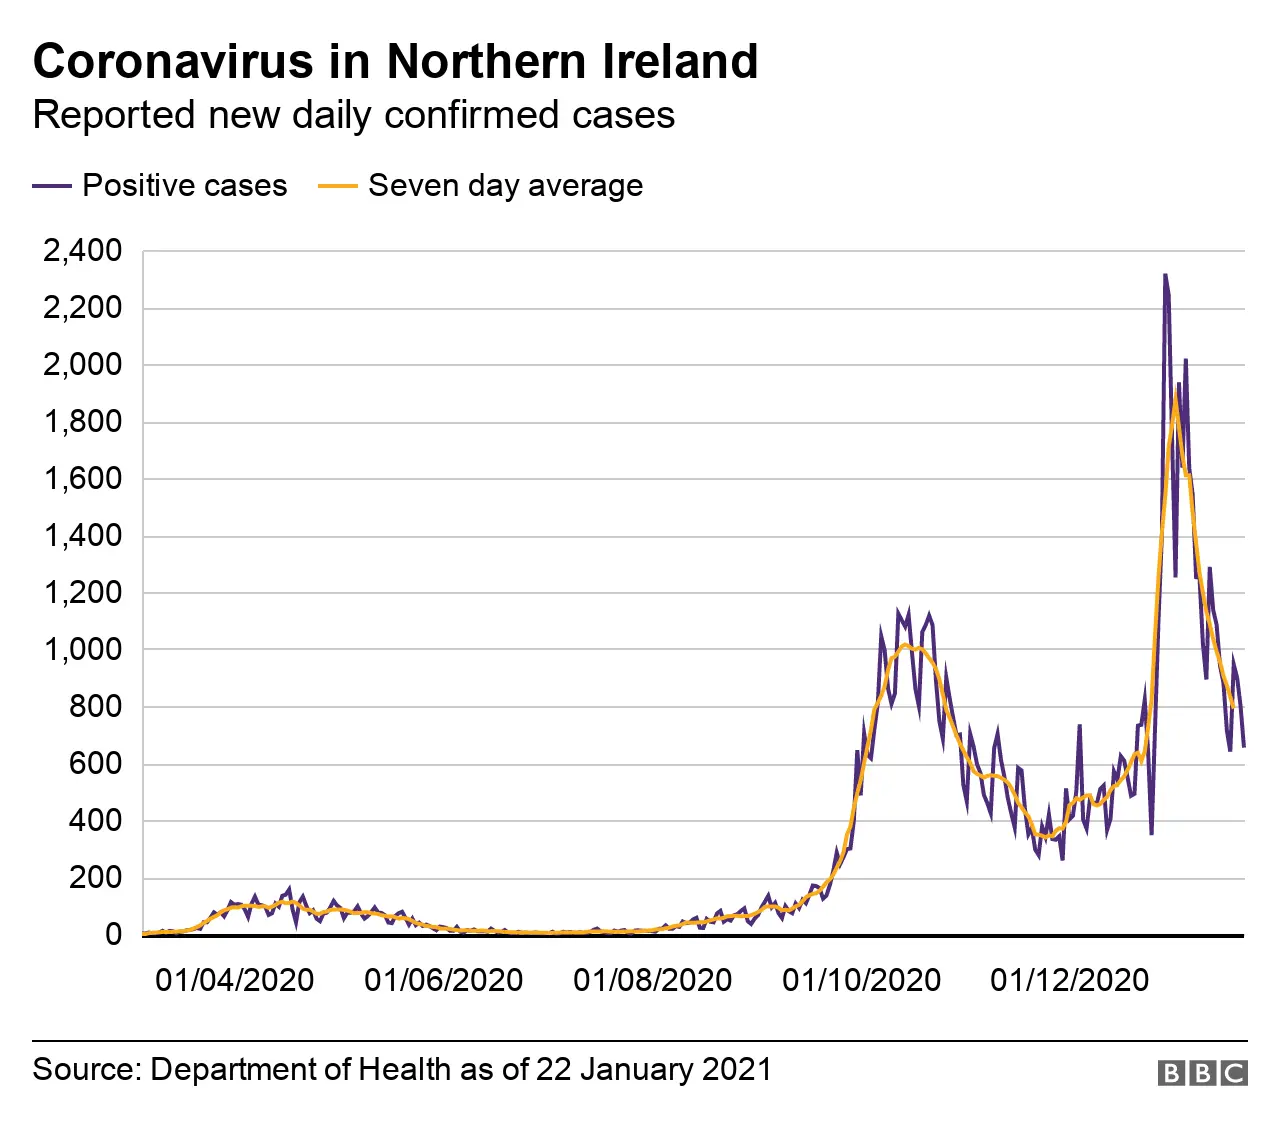
The standard way of expressing this rate is the number of cases per 100,000 population - it's usually calculated over a seven-day period.
According to figures from the BBC's Data Unit, which cover the seven days up until 17 January, Armagh City, Banbridge and Craigavon Borough Council currently has the worst infection rate in Northern Ireland.
It stands at 611 cases per 100,000 population.
For comparison, the highest in the UK is Knowsley near Liverpool with an infection rate of 1,069 per 100,000 population.
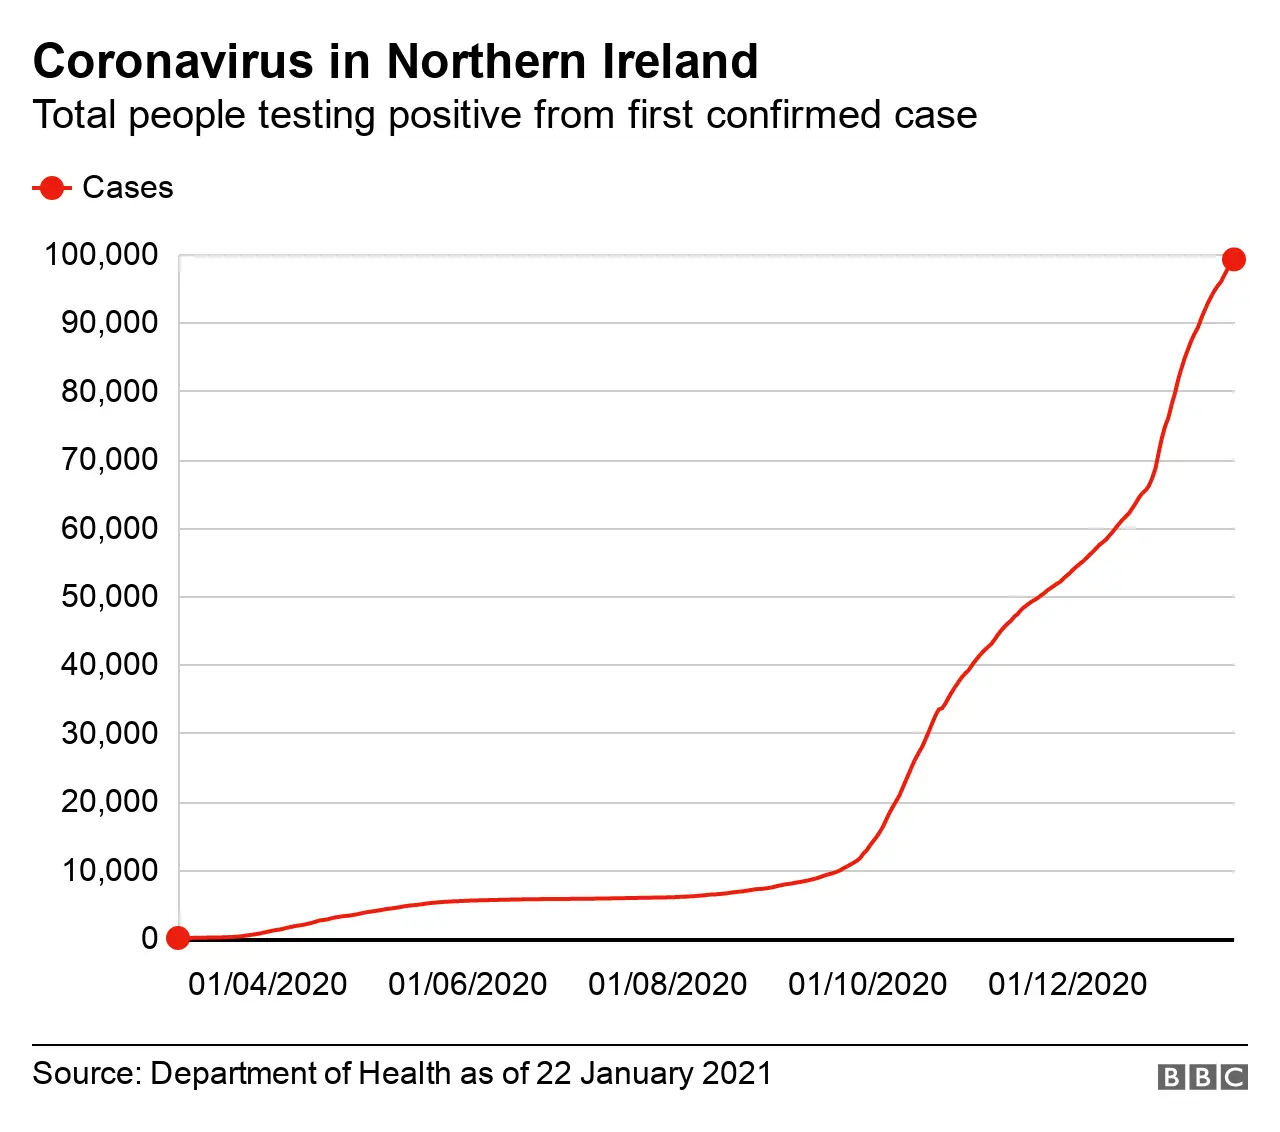
In the past authorities have looked at bringing in or increasing restrictions when the infection rate hits 200 cases per 100,000 population.
This puts into context the fact that only one council area - North Down and Ards - has a rate lower than that, and only just, at 197 cases per 100,000 population.
The falling infection rates, coupled with an estimated R number of less than 1, are cause for hope.

Vaccinations
So far Northern Ireland's vaccination programme has been impressive.
Leaving aside the argument on policy about whether first doses should be prioritised, the numbers indicate a rapid and extensive rollout.
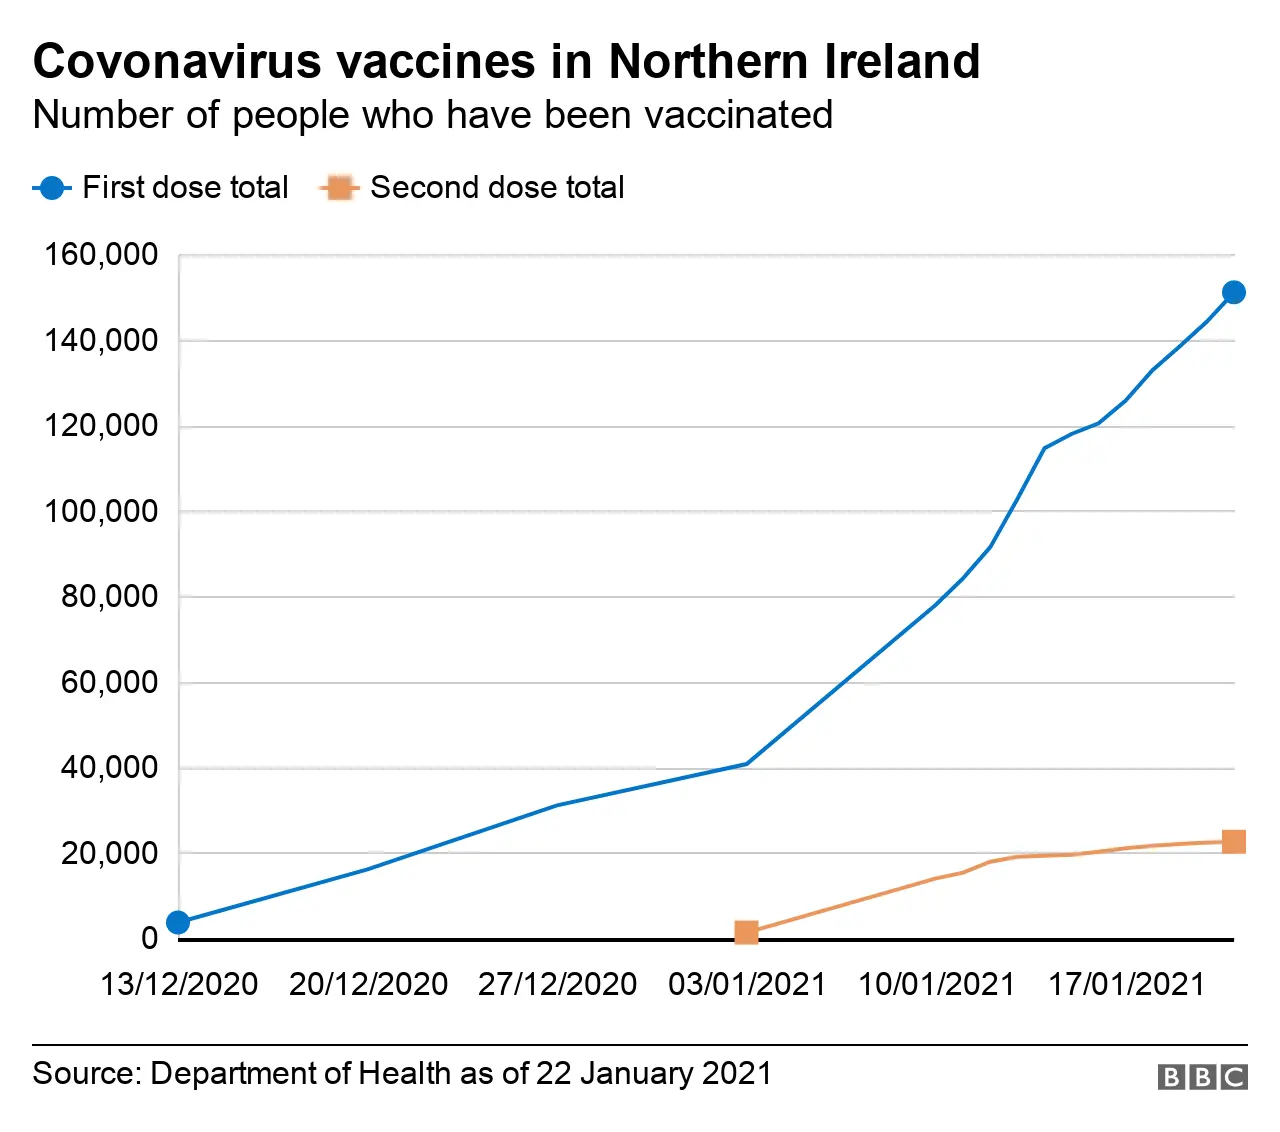
More than 150,000 people in Northern Ireland have received a Covid vaccine jab.
The rate stands at 10.5% of the adult population, with more than half of people aged 80 or over in Northern Ireland having had the jab.
The speed at which the vaccines are being delivered has slowed somewhat over the past week, according to official government data, but Northern Ireland remains one of the vaccination success stories in Europe and indeed the world.
