Cycling v public transport: How do cities compare?
 Getty Images
There are many downsides to driving to work: the stress from traffic, for one, and finding parking is another. For those of us who want to use alternative means – and live more than walking distance from the office – there are two main options: public transport and cycling.
Conventional wisdom dictates that cycling is by far the cheaper of the two: if you already own a bike, then there are practically no costs. BBC Capital decided to take a closer look, comparing the costs and the benefits in this article to see if that premise held true. As part of the research, we looked closely at the cost of cycling and public transport in 12 global cities to find the point where it becomes cheaper to ride to work.
For each city, we found the average cost of a new bike and accessories (helmet, lights, rucksack, pump and lock). We then factored in ongoing costs (servicing and maintenance) to get a monthly cost to ride to work.
We then compared that to the cost of a monthly pass on public transport for that city. In every city, the initial cost of cycling was much higher than public transport, but as the months go by, the higher monthly costs of public transport stack up, making cycling cheaper in the long run.
Here’s an example: In San Francisco, a monthly travel card costs $73. The average cost of a new bike and accessories is $289. In the first month, it’s cheaper to take public transport. But after five months, the cycling costs have only risen to $310 (factoring in 25% of the bike cost per year for maintenance) while cumulative public transport costs have grown to $365.
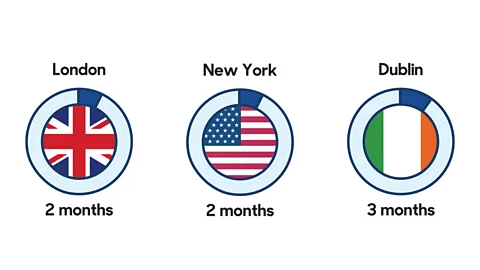
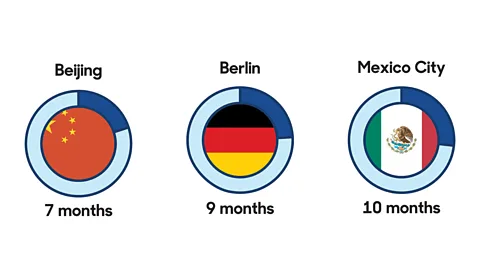
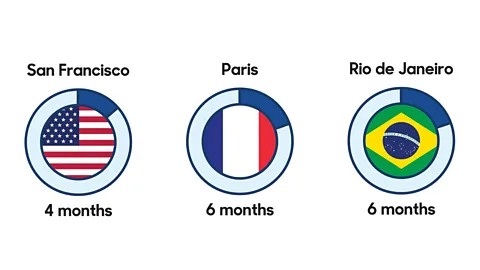
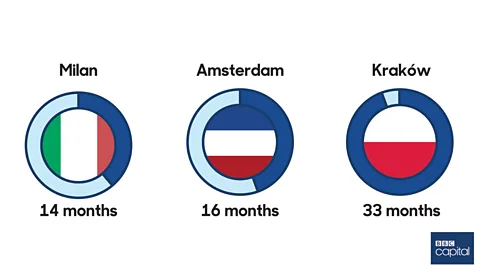
Take a look at the charts below to see how the cities compare. One circle represents three years.
Zero to three months
 Hiewon Sohn
Cycling is best value relative to public transport in London, since London has the most expensive public transport: £124.50 ($159) for a monthly Oyster card covering the city centre.
Four to six months
 Hiewon Sohn
One accessory drove the price up for two-wheeled commuters in Rio: the lock. The best-selling locks in Brazil were expensive – with an average cost of $106 – suggesting high rates of bike theft.
Seven to 12 months
 Hiewon Sohn
Of the 12 cities, Mexico City had the cheapest public transport, at $16 per month – but bikes are cheap there too.
Thirteen to 36 months
 Hiewon Sohn
We found that cycling in Amsterdam was surprisingly expensive: this is partly because the average bike cost includes e-bikes, and 28% of bikes sold in the Netherlands last year were e-bikes. Cycling is the worst value in Kraków. This is down to the low price of public transport – just $23 per month – and the relatively high price of a new bike.
Bicycle cost is based on average for country in 2015. Data for most countries includes e-bikes. Bicycle costs for Brazil, China and Mexico are estimated from a range of sources. Accessories cost is the median cost of the top ten best-selling products on the national version of Amazon or equivalent website. Monthly travel-card cost data is for mid-2016.
Assumptions: Bicycle is bought new, service and maintenance is 25% of cost of bike per year, and public transport costs remain constant over time period
Sources: Confederation of the European Bicycle Industry, National Bicycle Dealers Association (US), Numbeo, national transportation sites, various bike and accessory retail sites.
