US mid-term election results 2018: Maps, charts and analysis
In a dramatic election night President Donald Trump's Republican Party retained control of the Senate and the Democrats took control of the House of Representatives.
 BBC
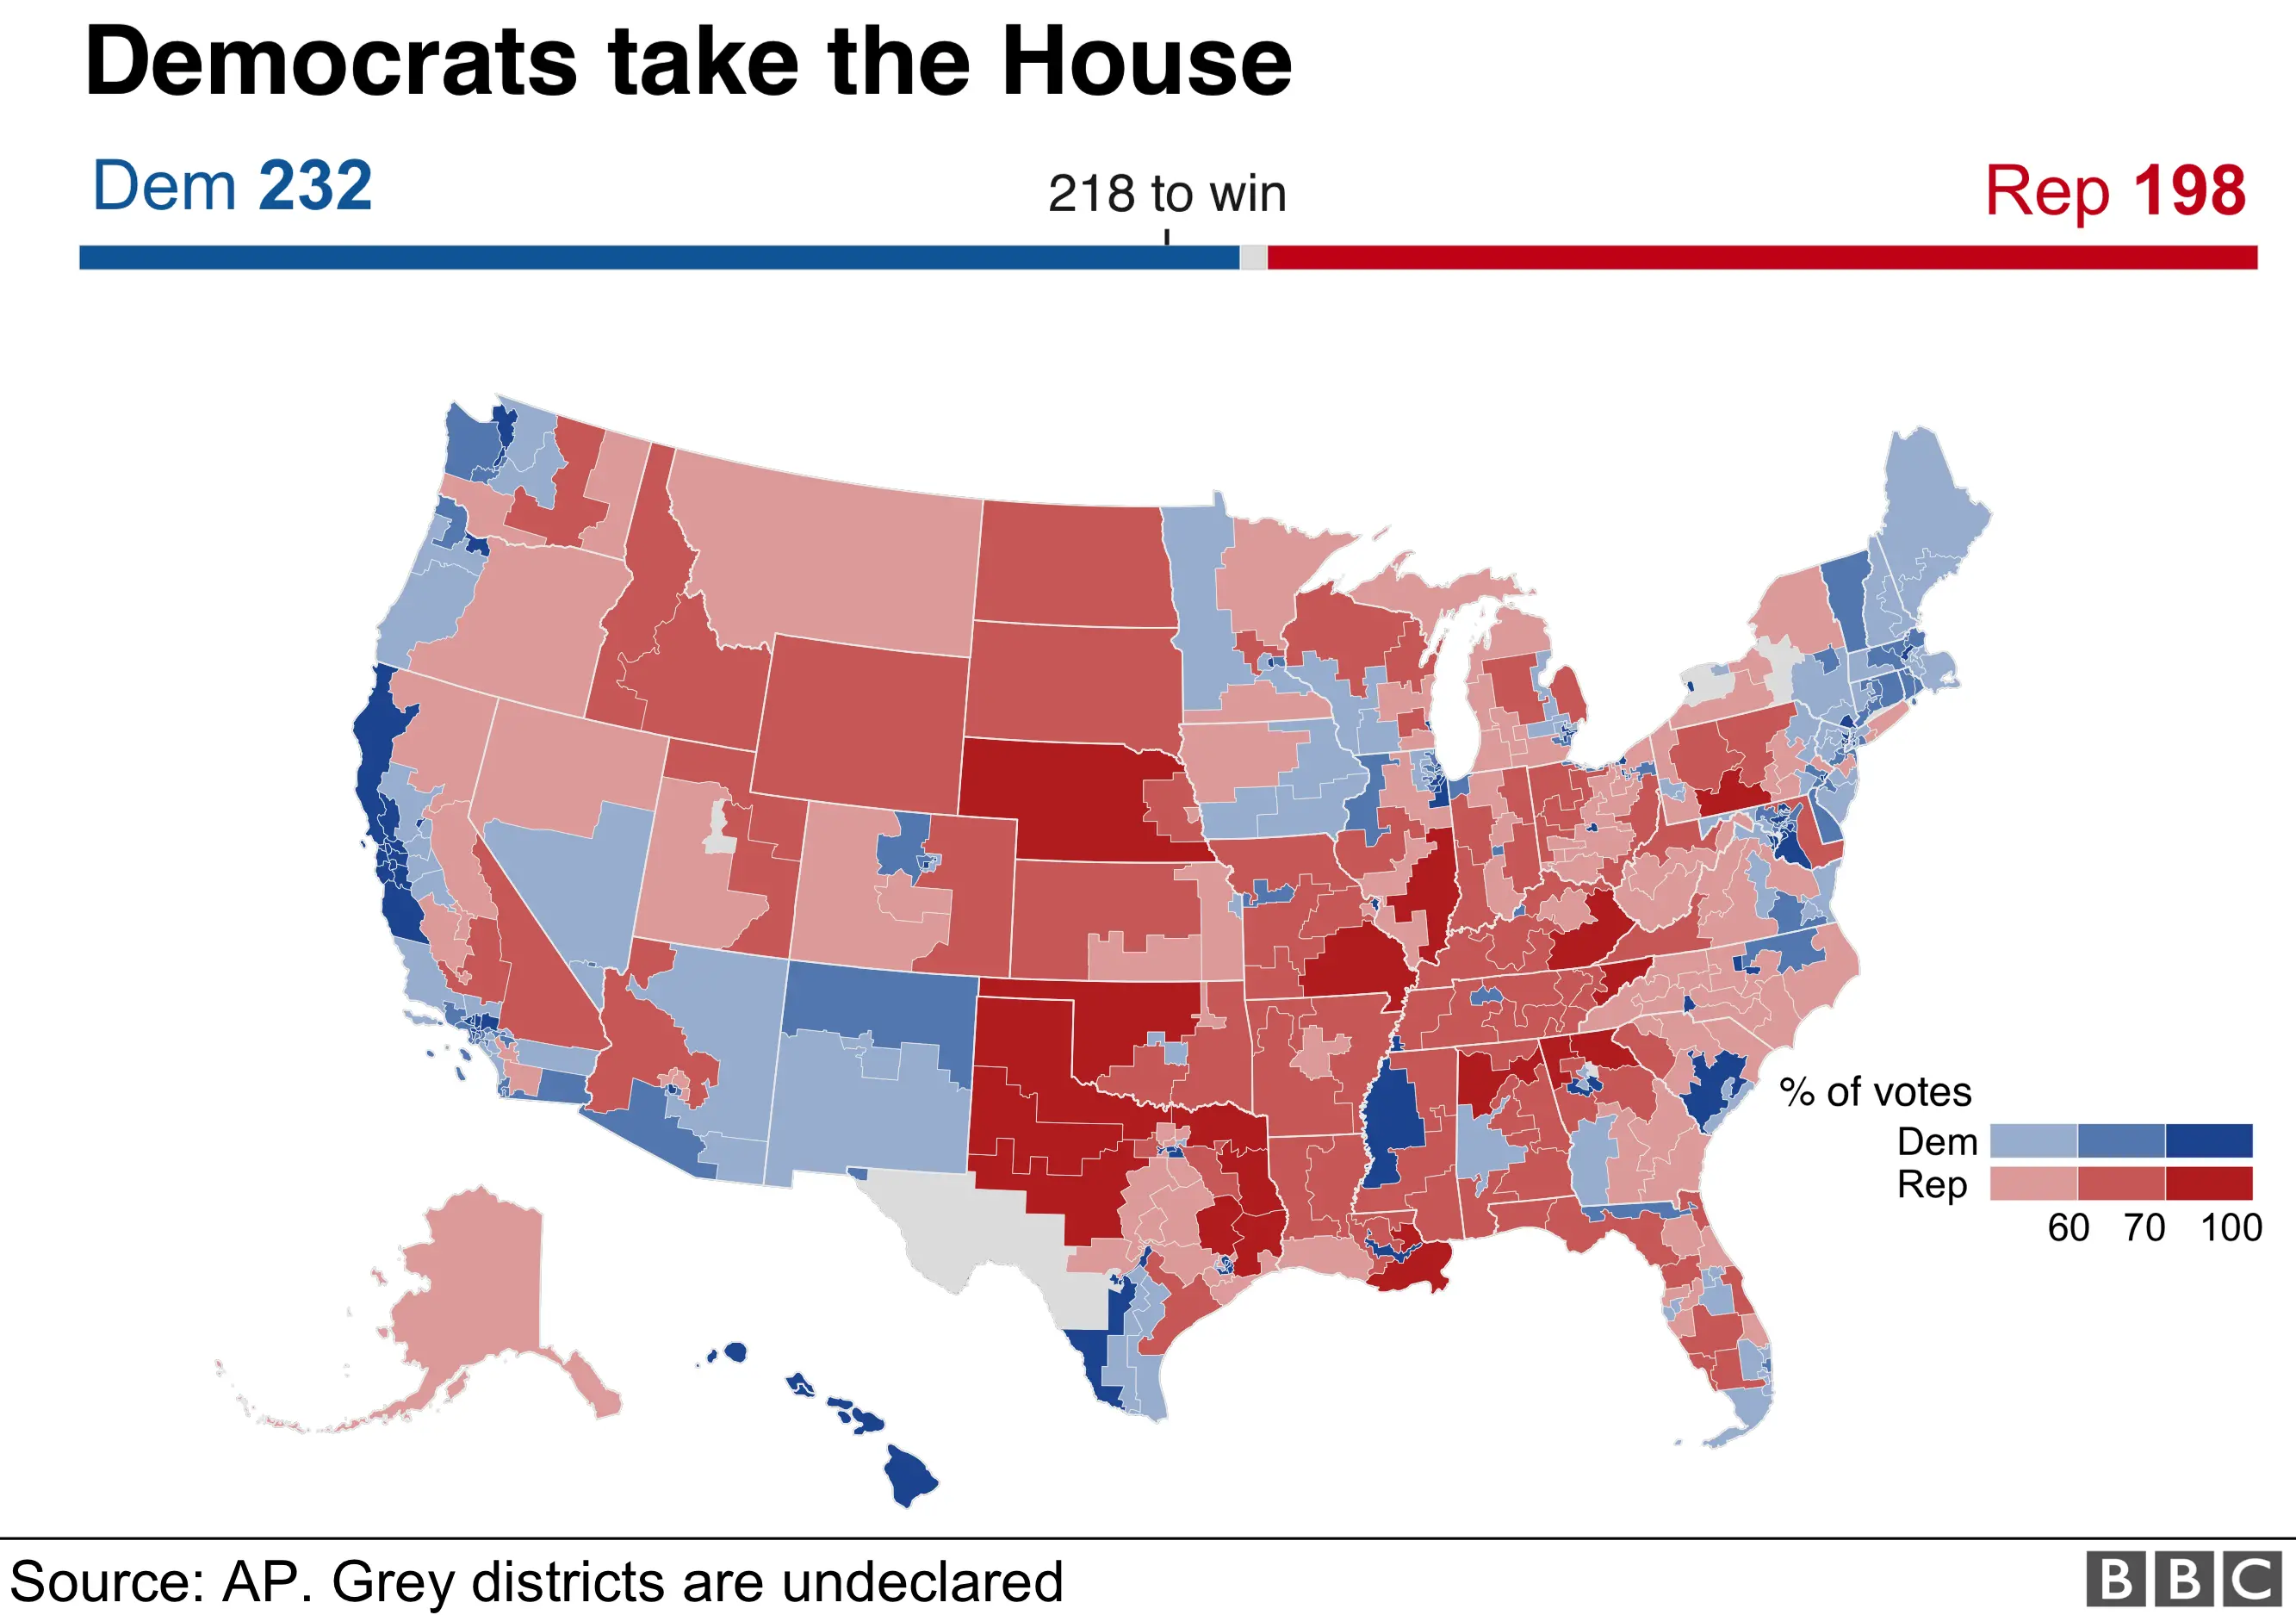
BBCThe Democrats gained more than the 23 seats they needed to take control of the House. It is the first time the party has held the majority in the lower house of Congress for eight years. The loss of the House will make it harder for President Trump to push his policies forward.
 BBC
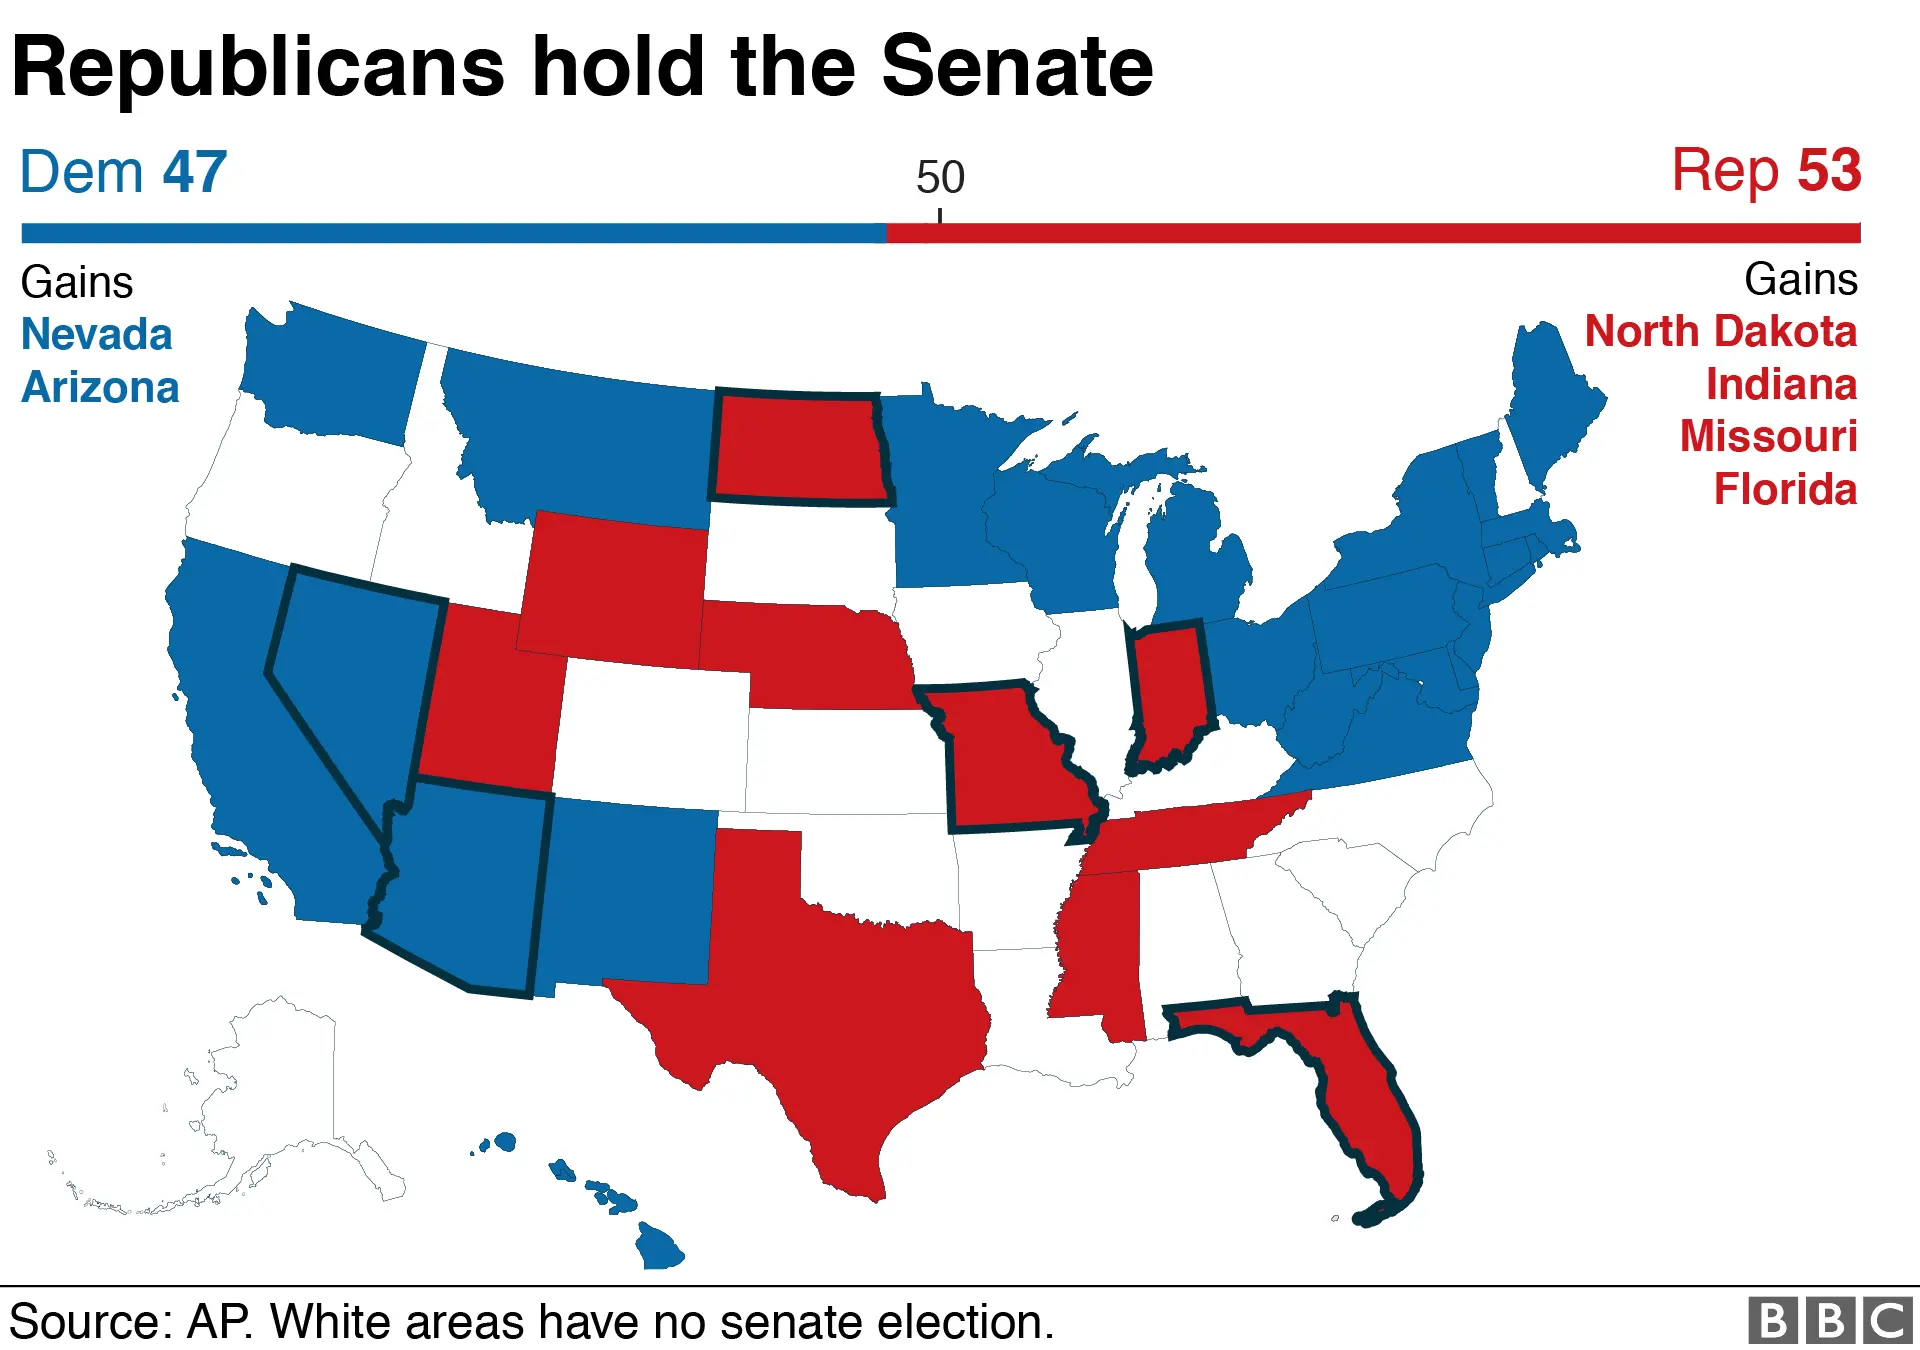
BBCMeanwhile, the Republicans have kept control of the Senate, the upper chamber of Congress, and will increase their majority. They gained Indiana, Missouri and North Dakota from the Democrats, while the Democrats gained seats in Nevada and Arizona.
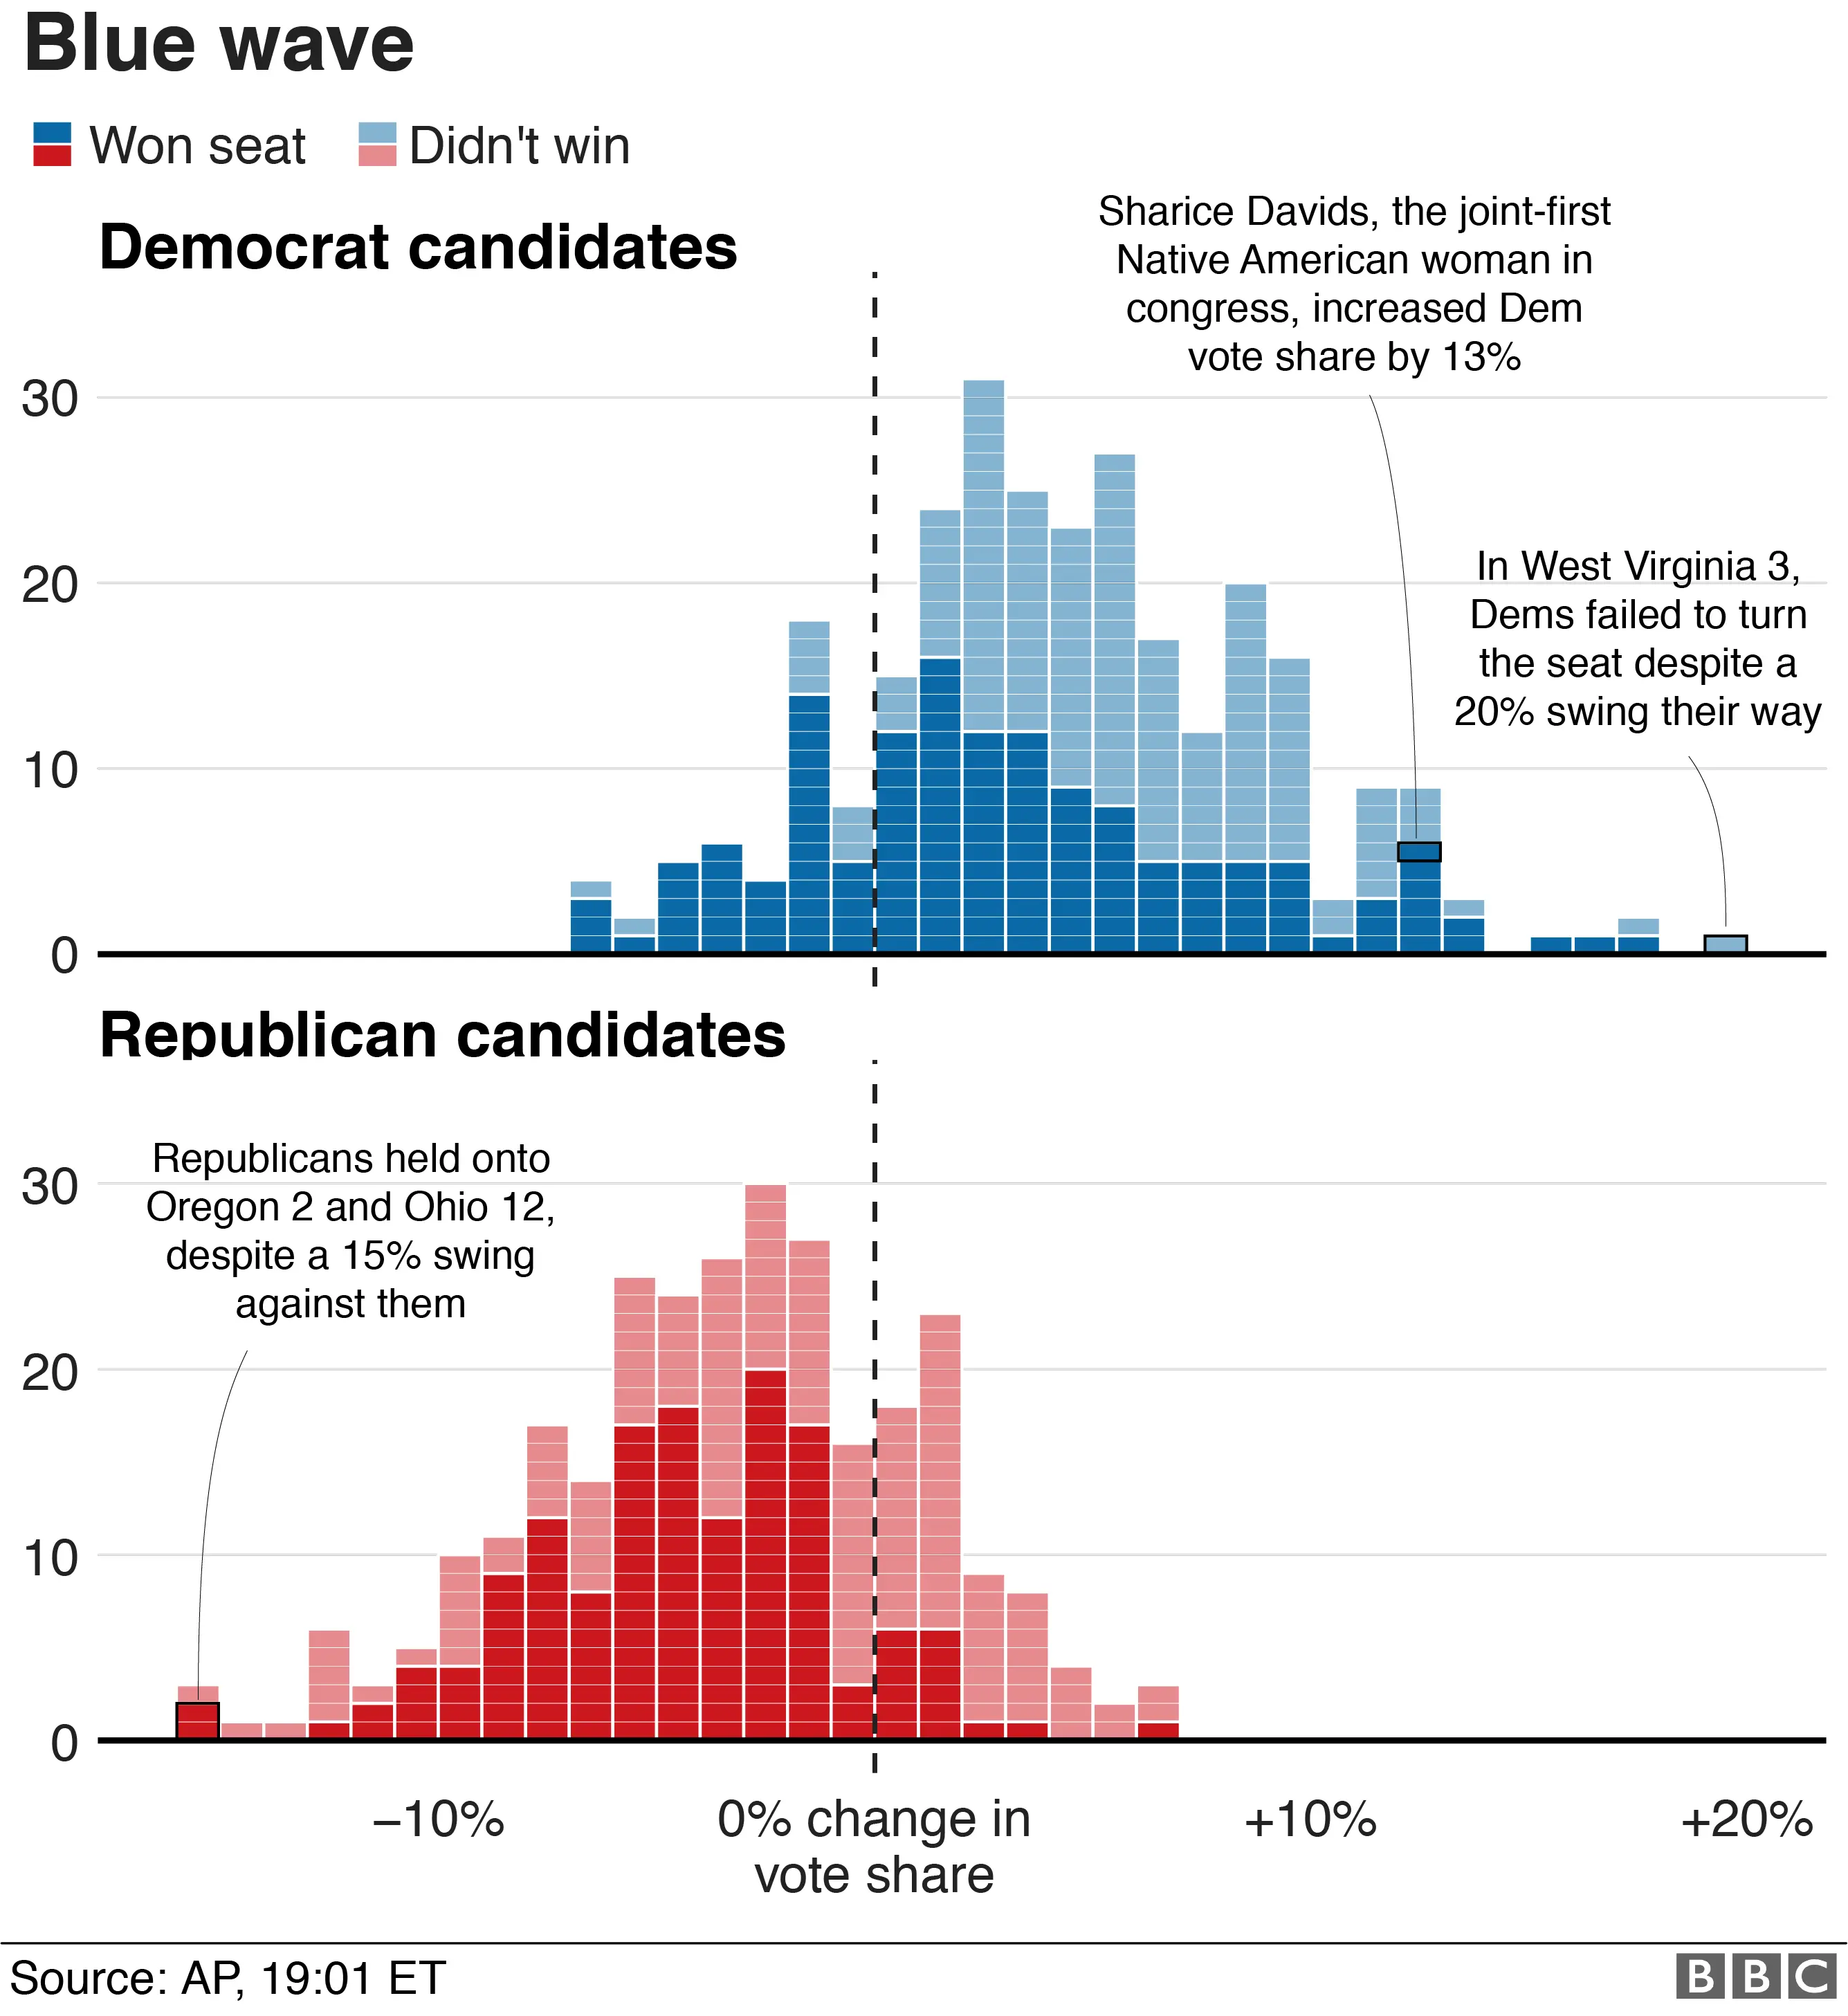
There was talk before the election of a rising "blue wave" - Democrats increasing their vote share across the country.
 BBC
BBCThe Democrats increased their vote share in 239 districts, but they didn't win all of them. In West Virginia's 3rd district, there was a 20% swing towards the Democrats, but the seat still went to Republican Carol Miller.
One Democrat who substantially increased her party's share was Sharice Davids, the joint-first Native American Congresswoman. She improved the Democrats' vote by 13% to win Kansas' 3rd district.
The Republicans raised their vote share in just 67 districts.
 BBC
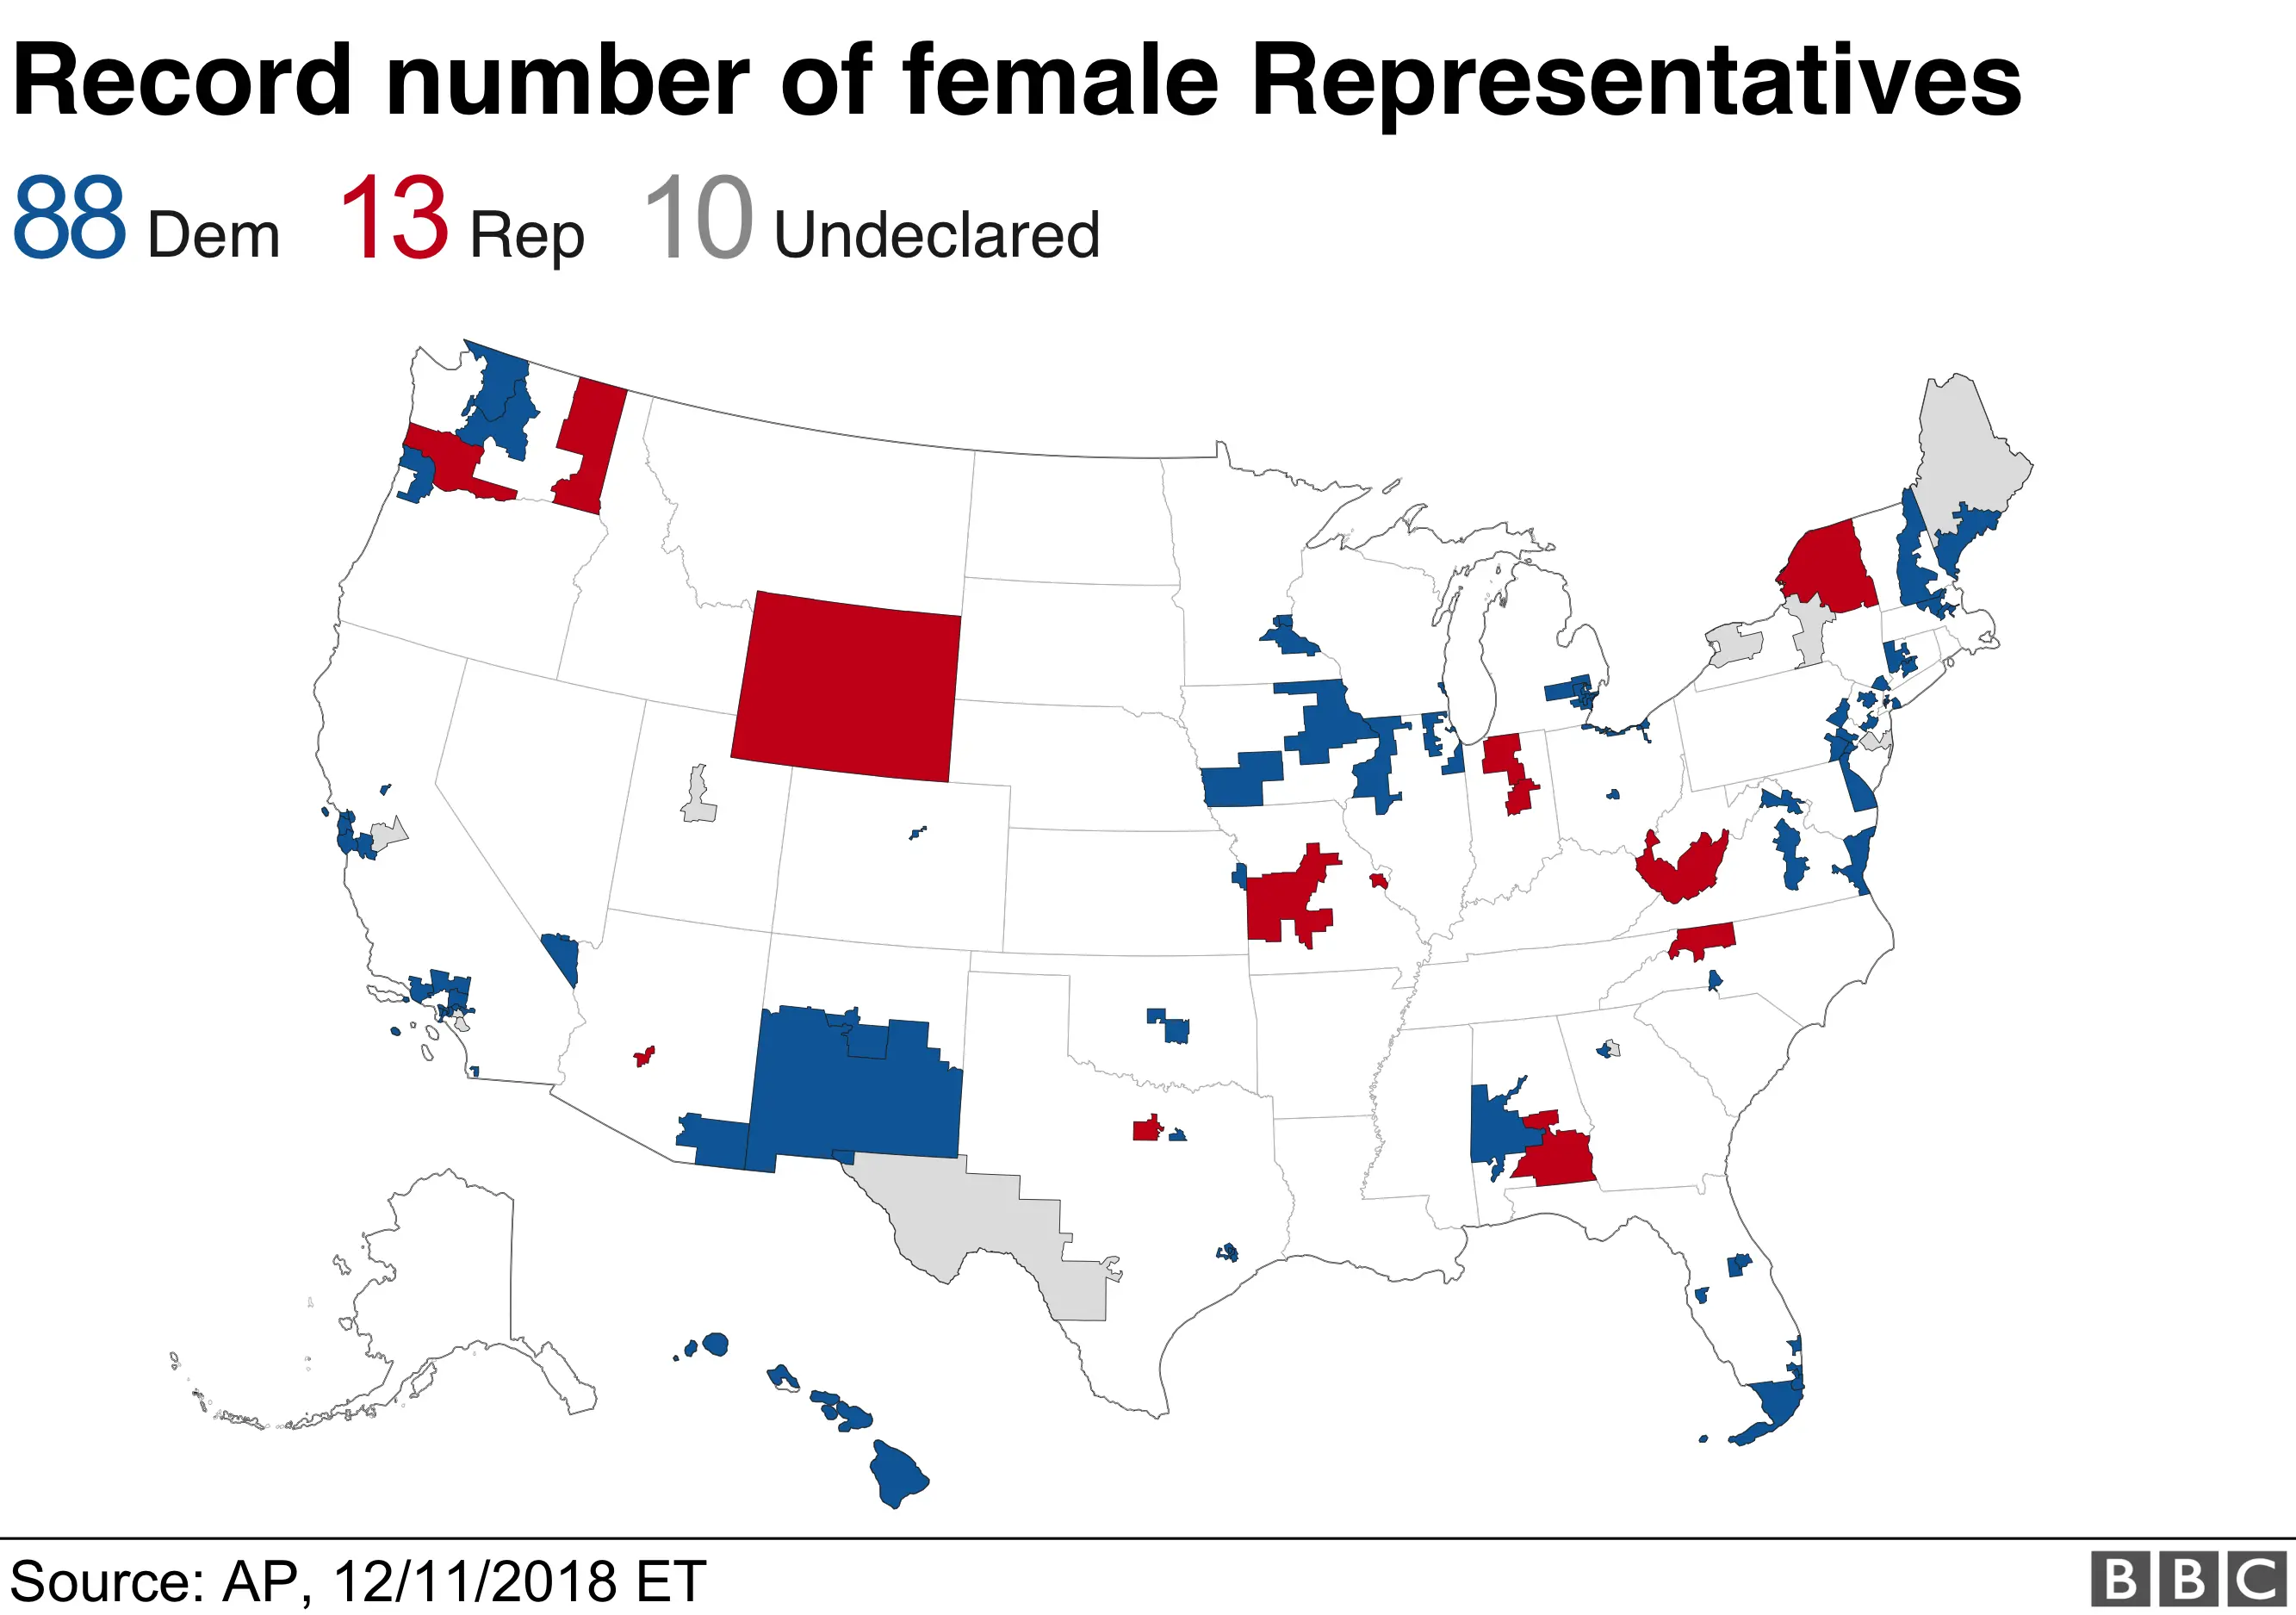
BBCThere will be more women in the House than in any previous year, while the total number of women in Congress overall will be at a record high after the mid-terms, overtaking the current tally of 107.
Click on the box below for detailed results, provided by AP. Switch between the Senate, House and Governor tabs to see the state of each map, and click on states or districts to explore vote counts in individual races.
High turnout
The 2018 mid-terms is set to be historical for voter turnout. With just a few seats left to be re-counted, 49.2% of those allowed to vote have done so.
This is higher than any year since 1914. In 2014, just 37% of those eligible voted.
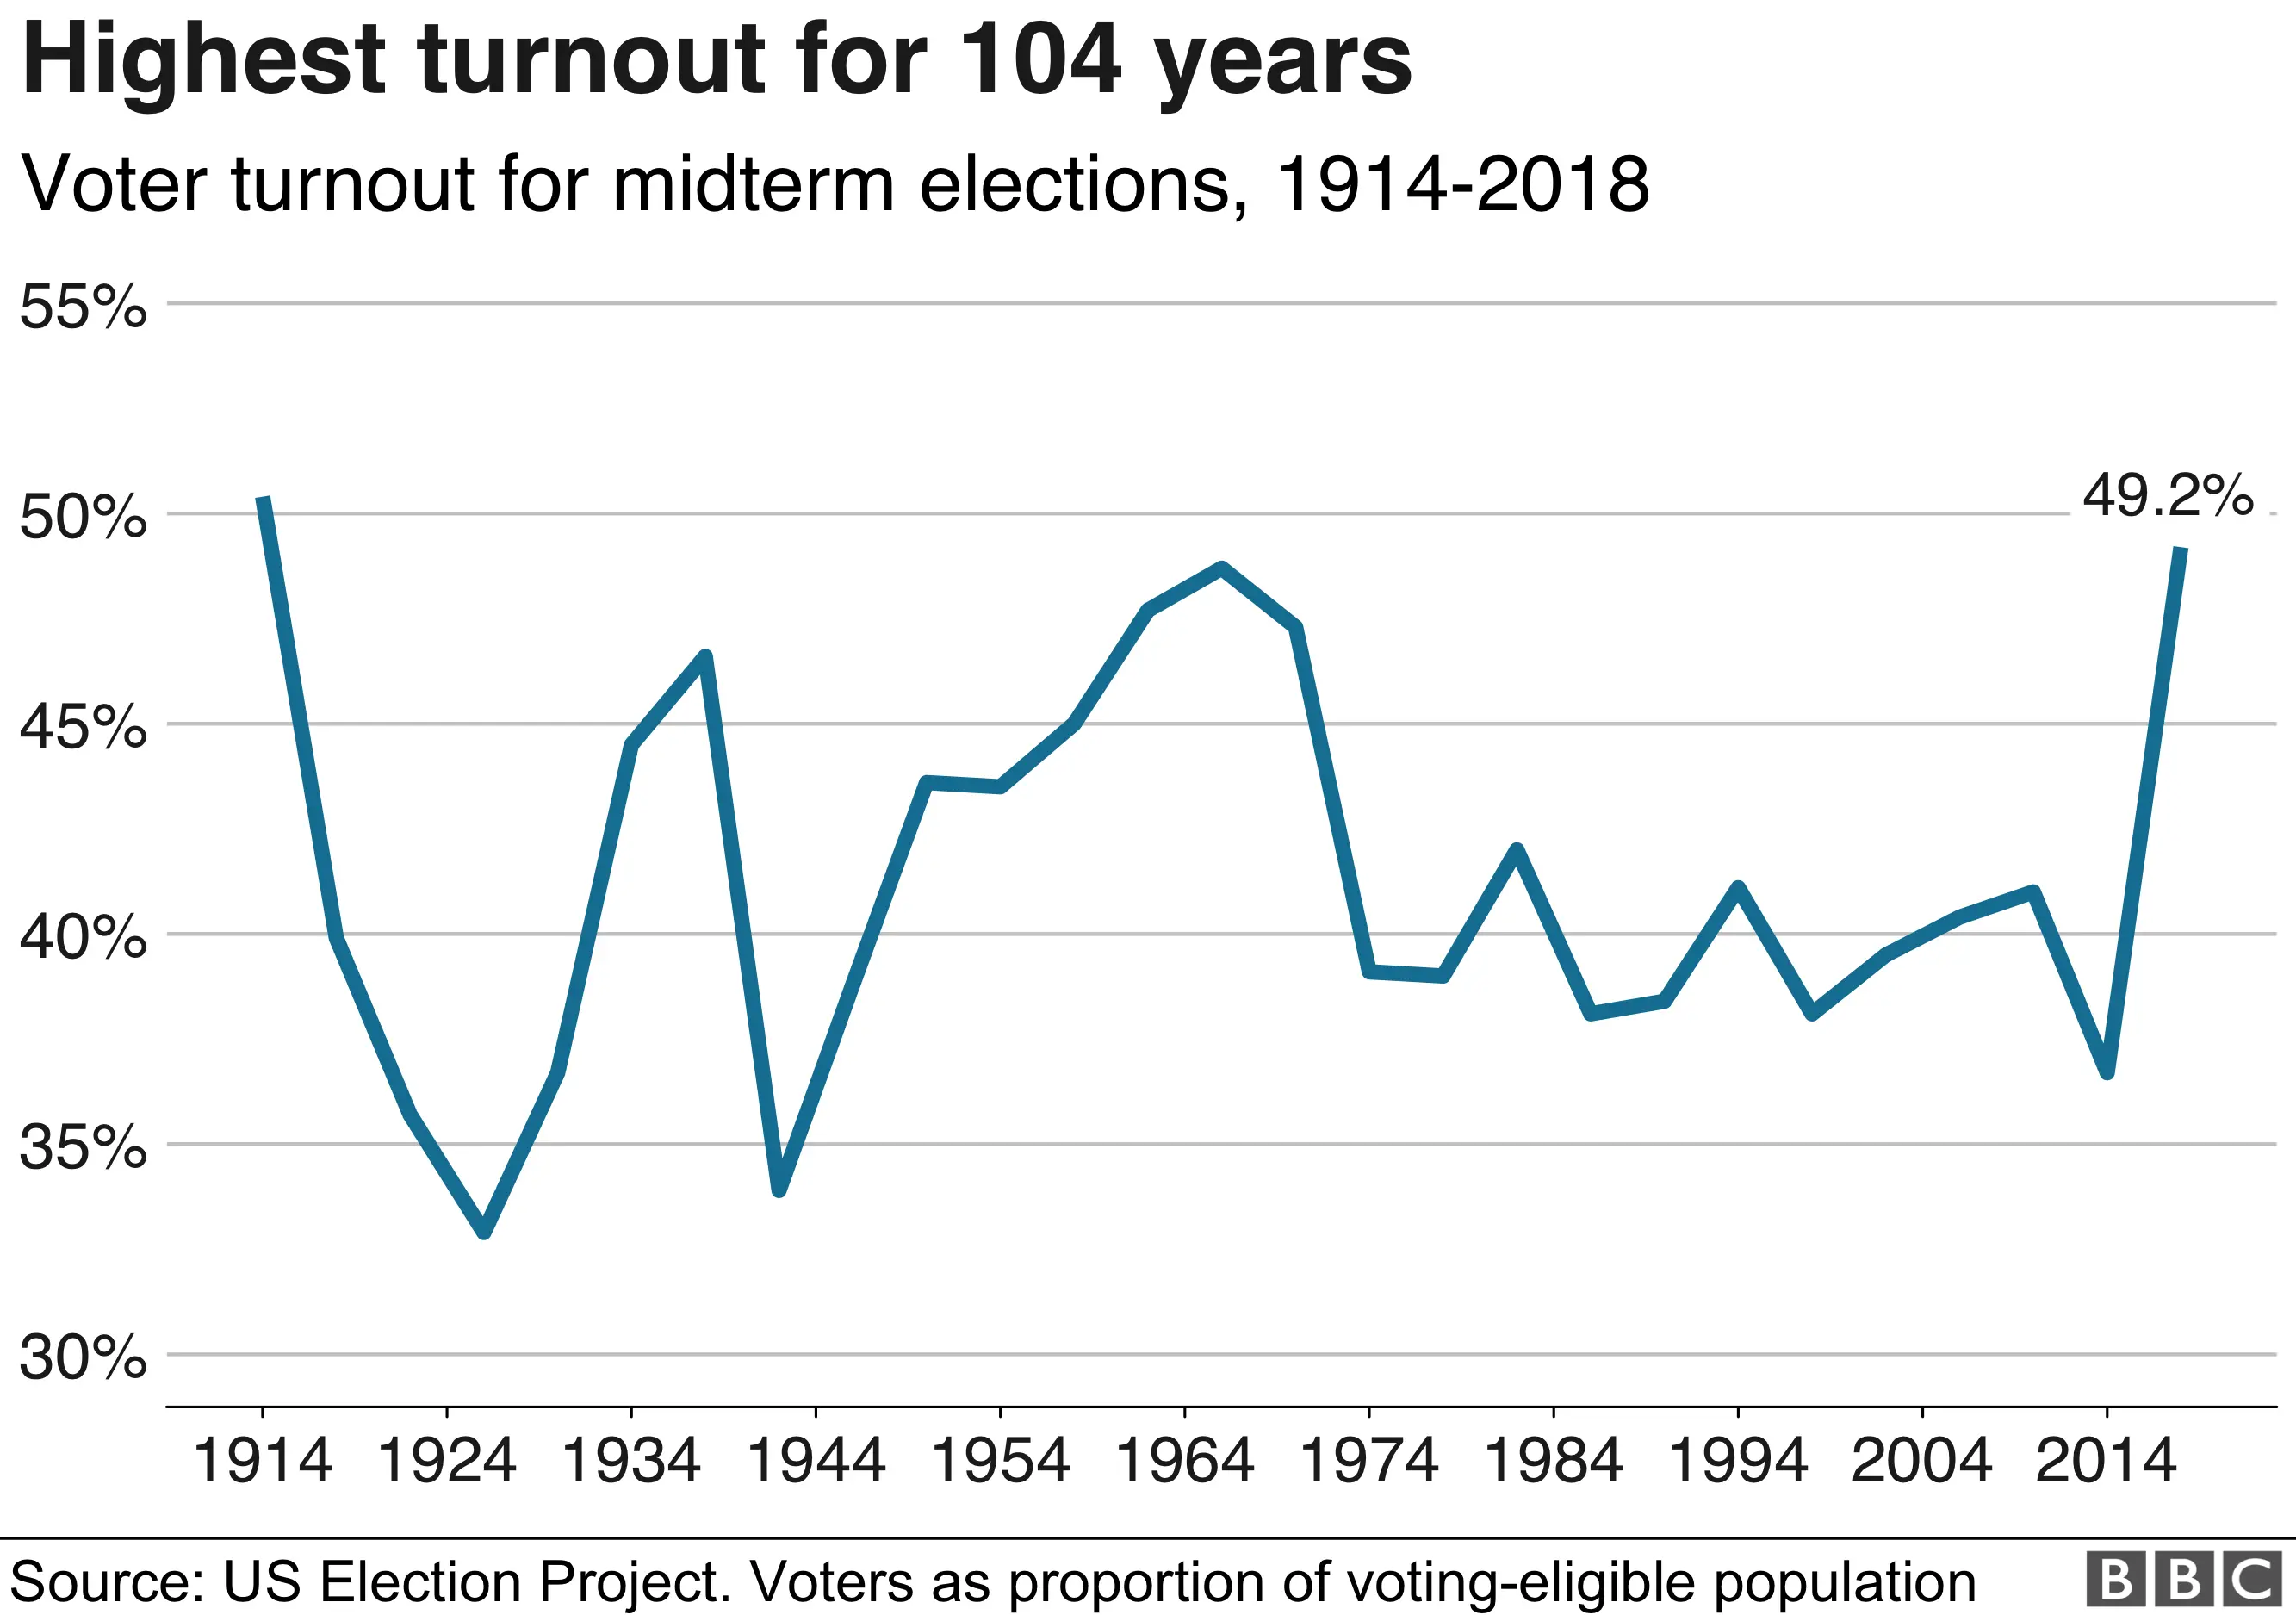
Some 115 million votes were cast in the House in 2018, according to estimates by the US Elections Project, up from 83 million in 2014.
Democrat gains
In the House, Democrats increased their vote share in hundreds of seats, with vote share dropping in just 47 seats.
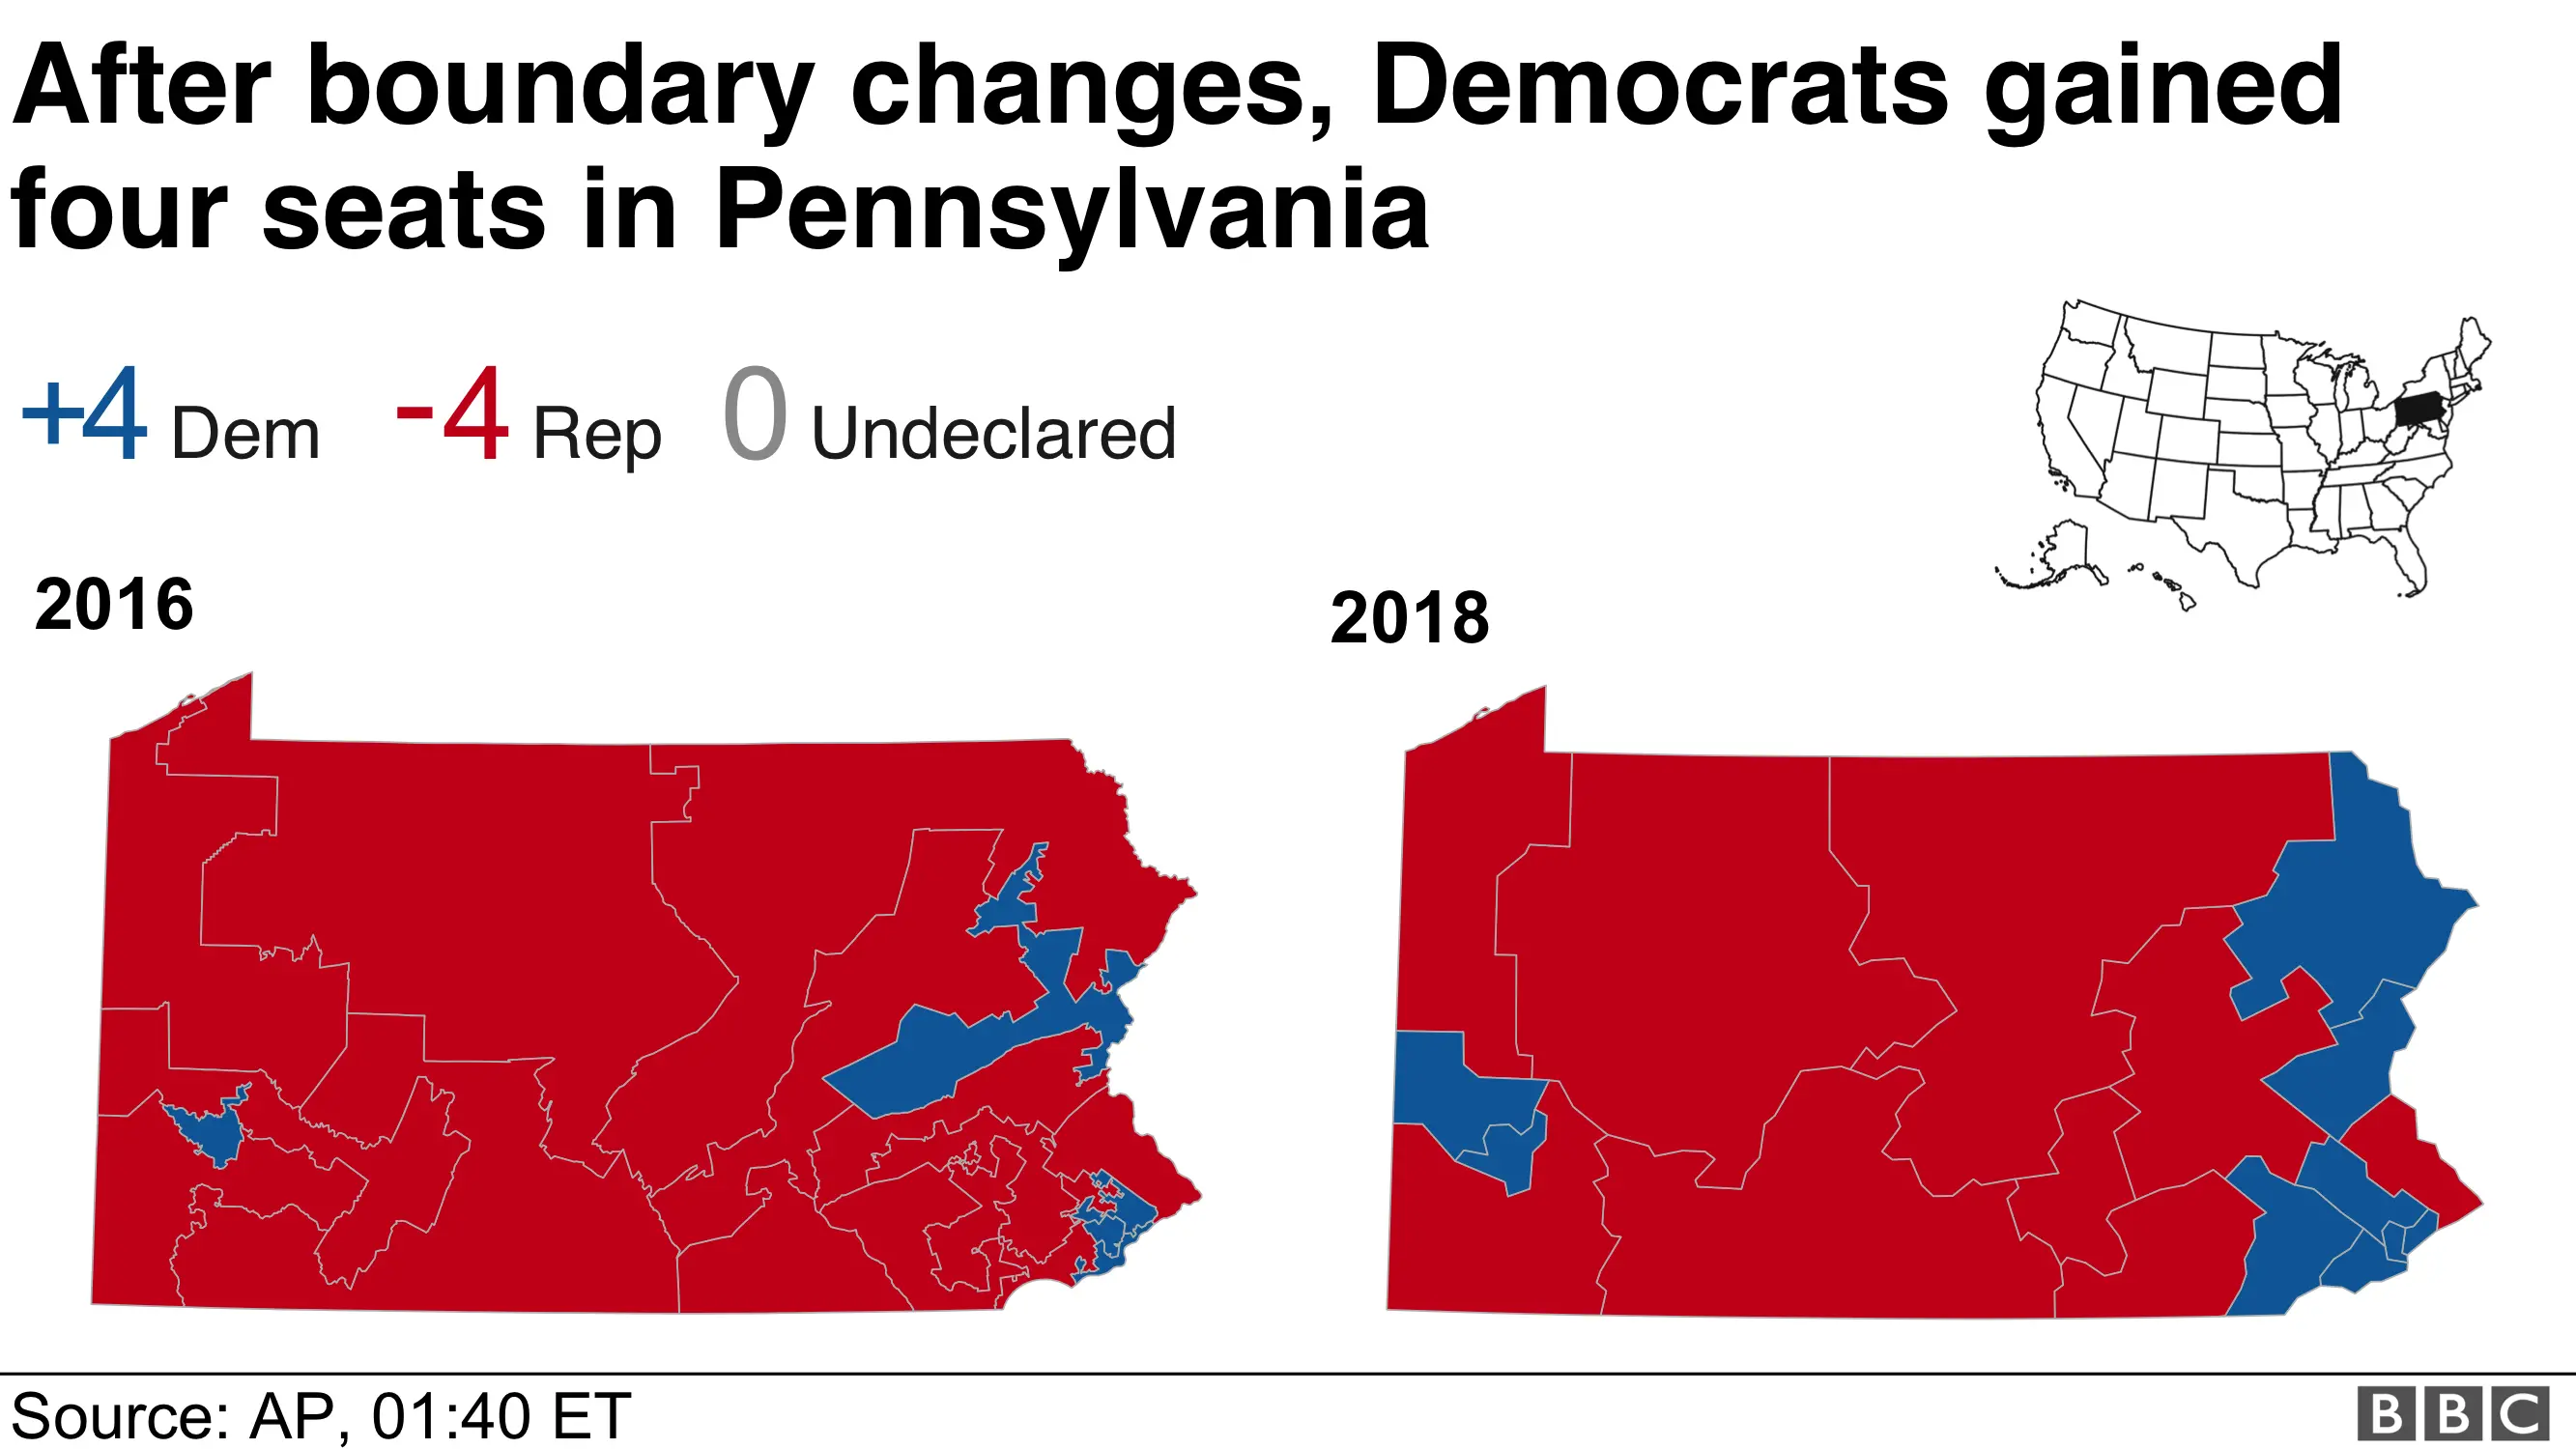
Boundary changes also helped them, as changes in Pennsylvania saw them gain four seats in the state, compared to 2016.
They also gained two seats in the southern tip of Florida, a classic swing state.

Who voted how?
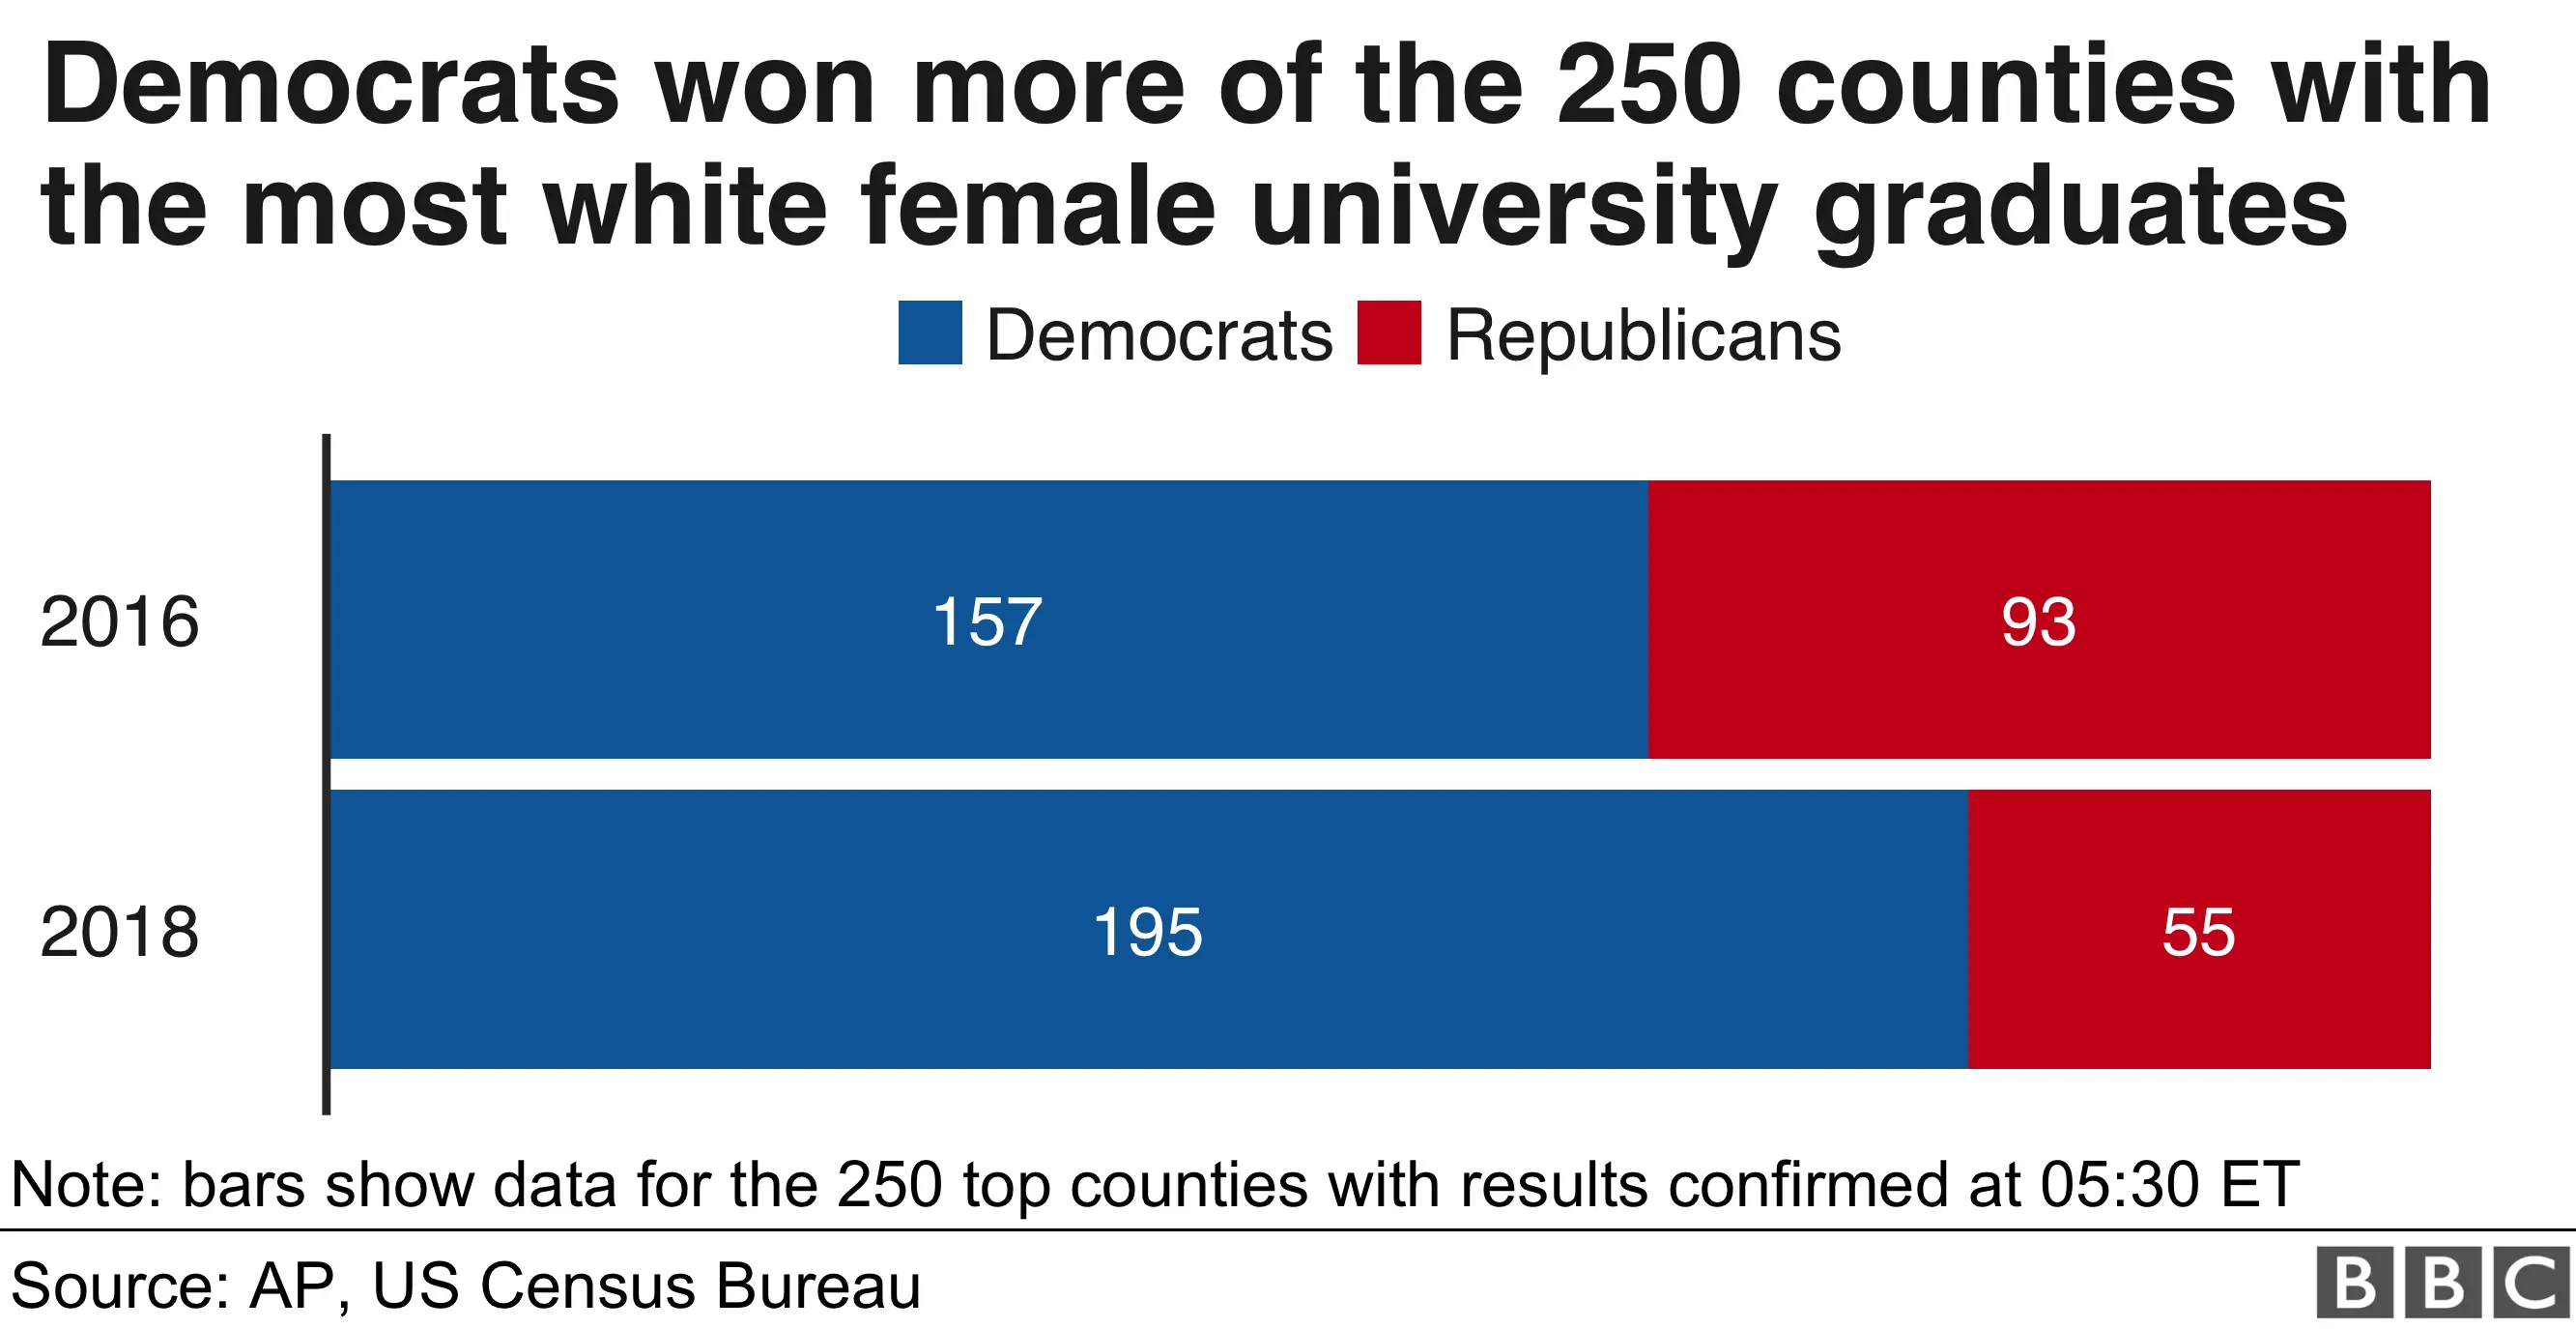
Compared with the last Congressional election in 2016, Republicans lost support in those counties with the most university-educated white women.
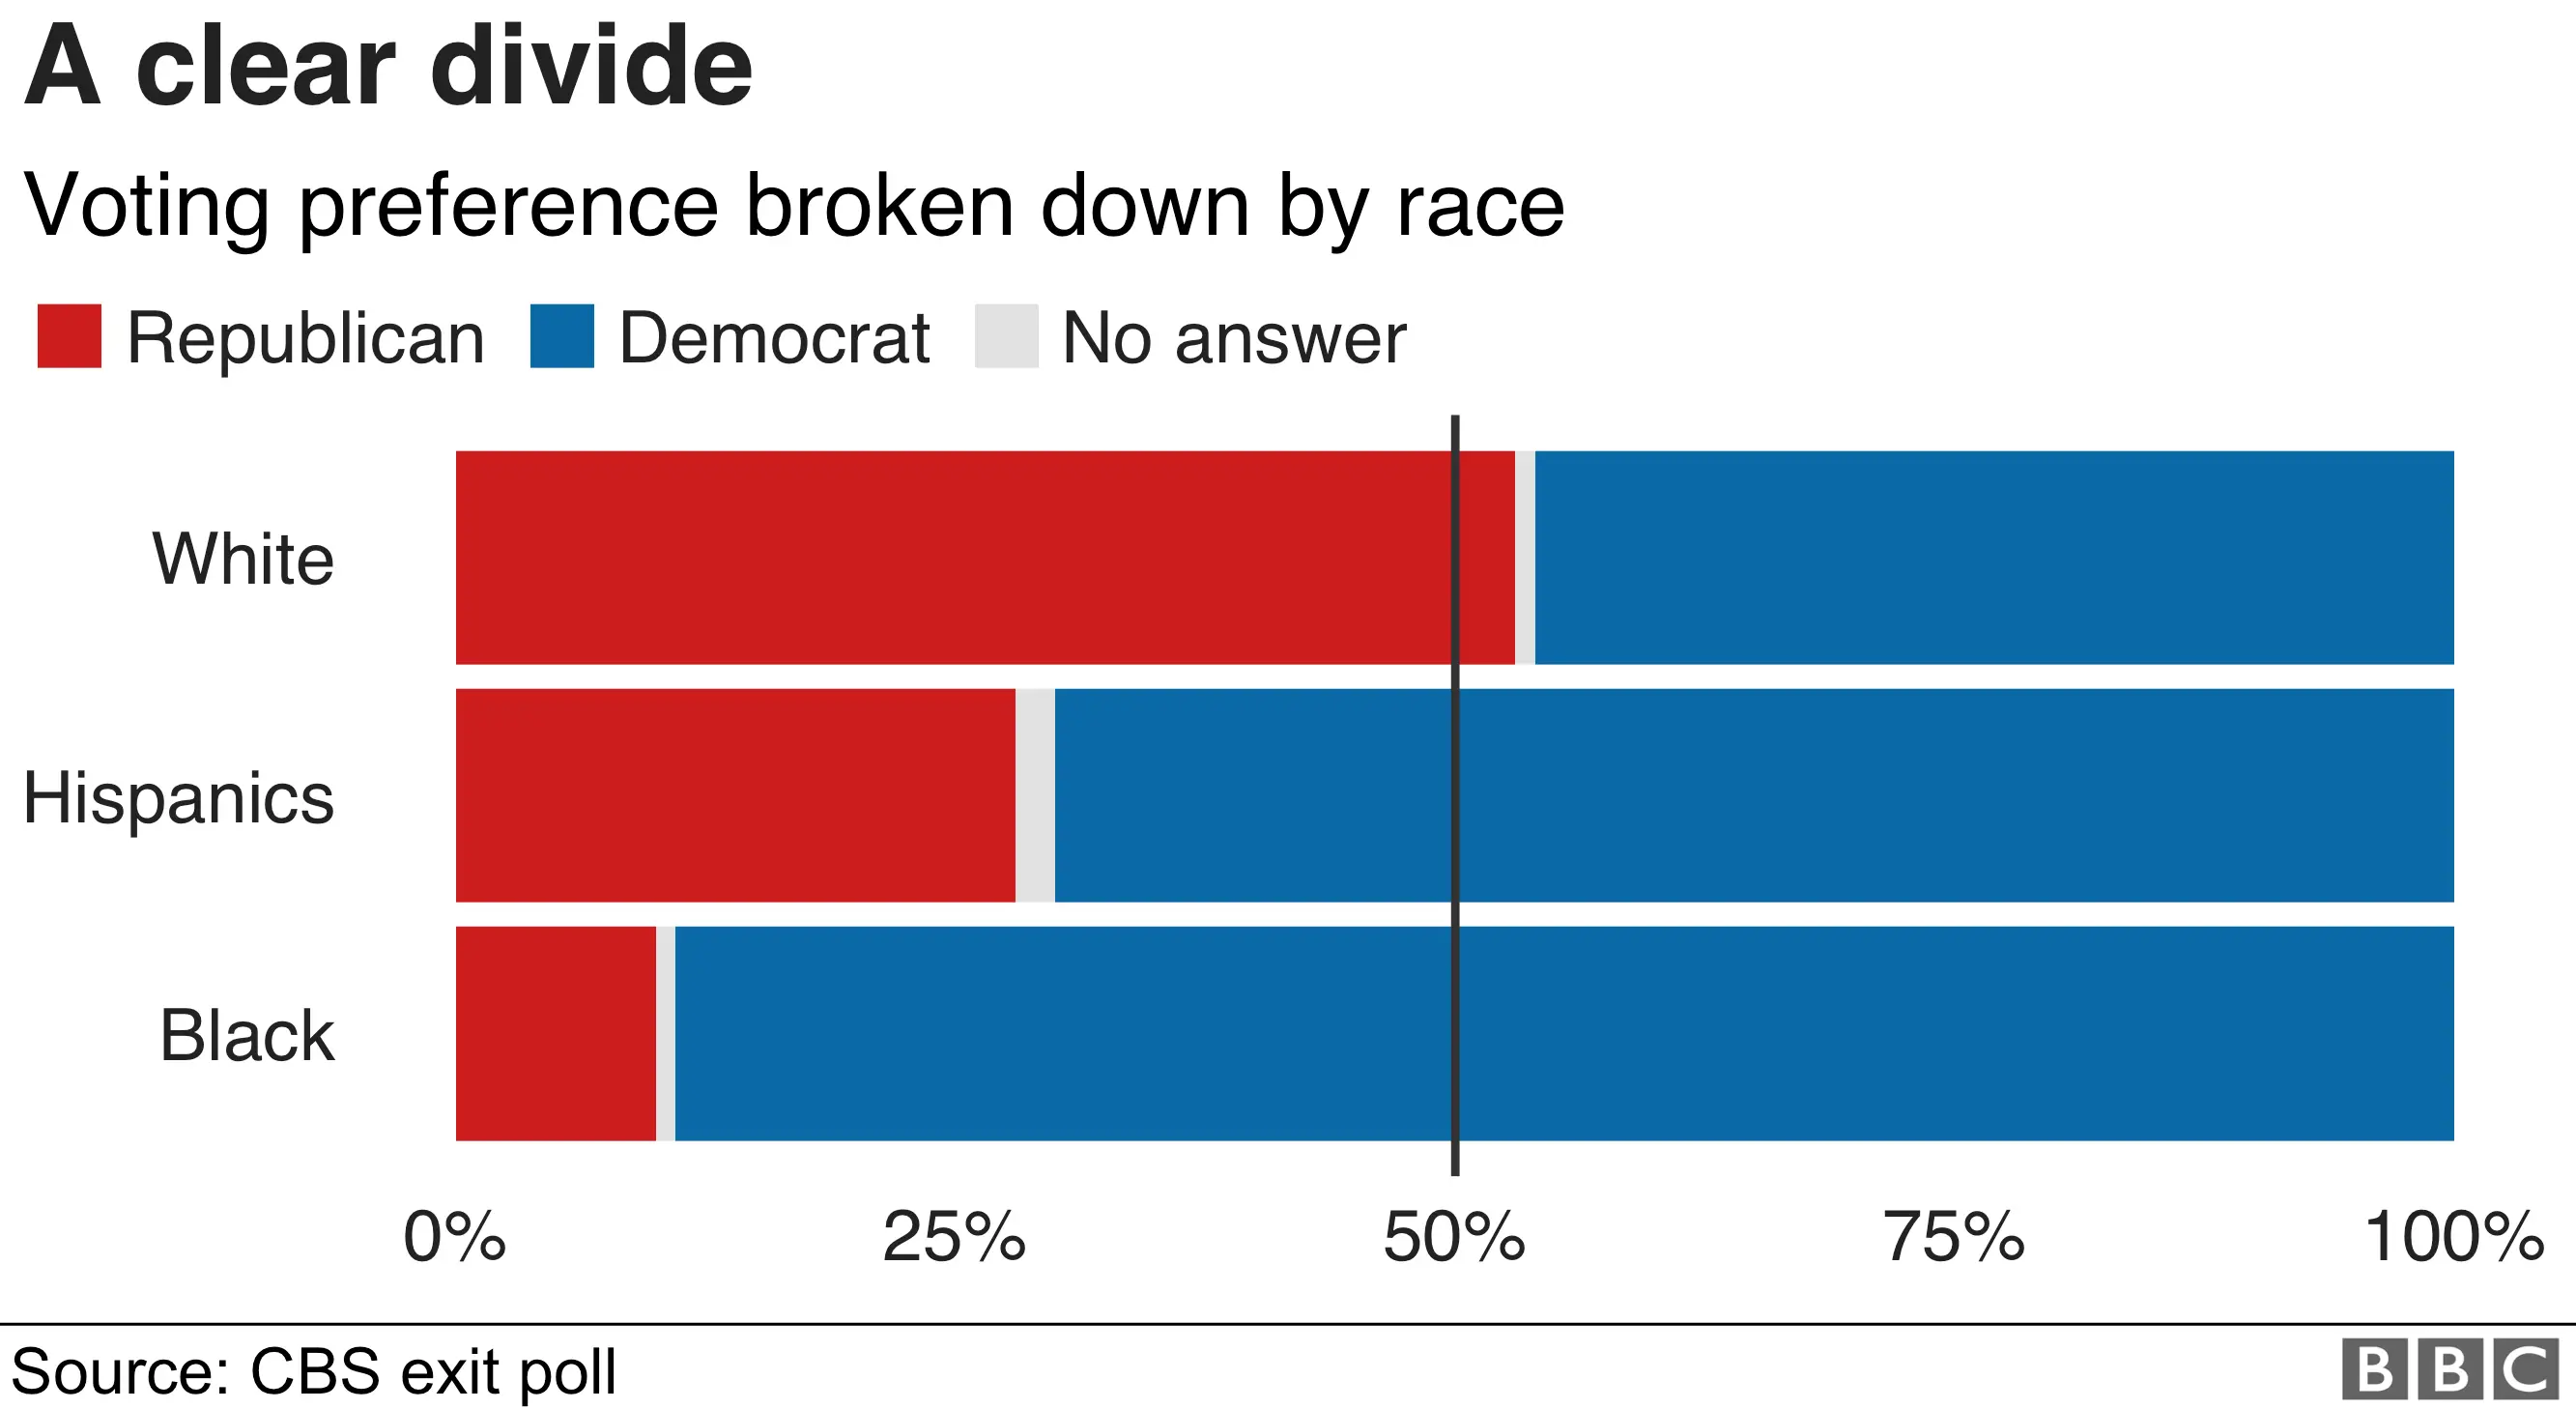
While minorities are much more likely to vote Democrat.
And in rural areas, there was strong support for Republican candidates.
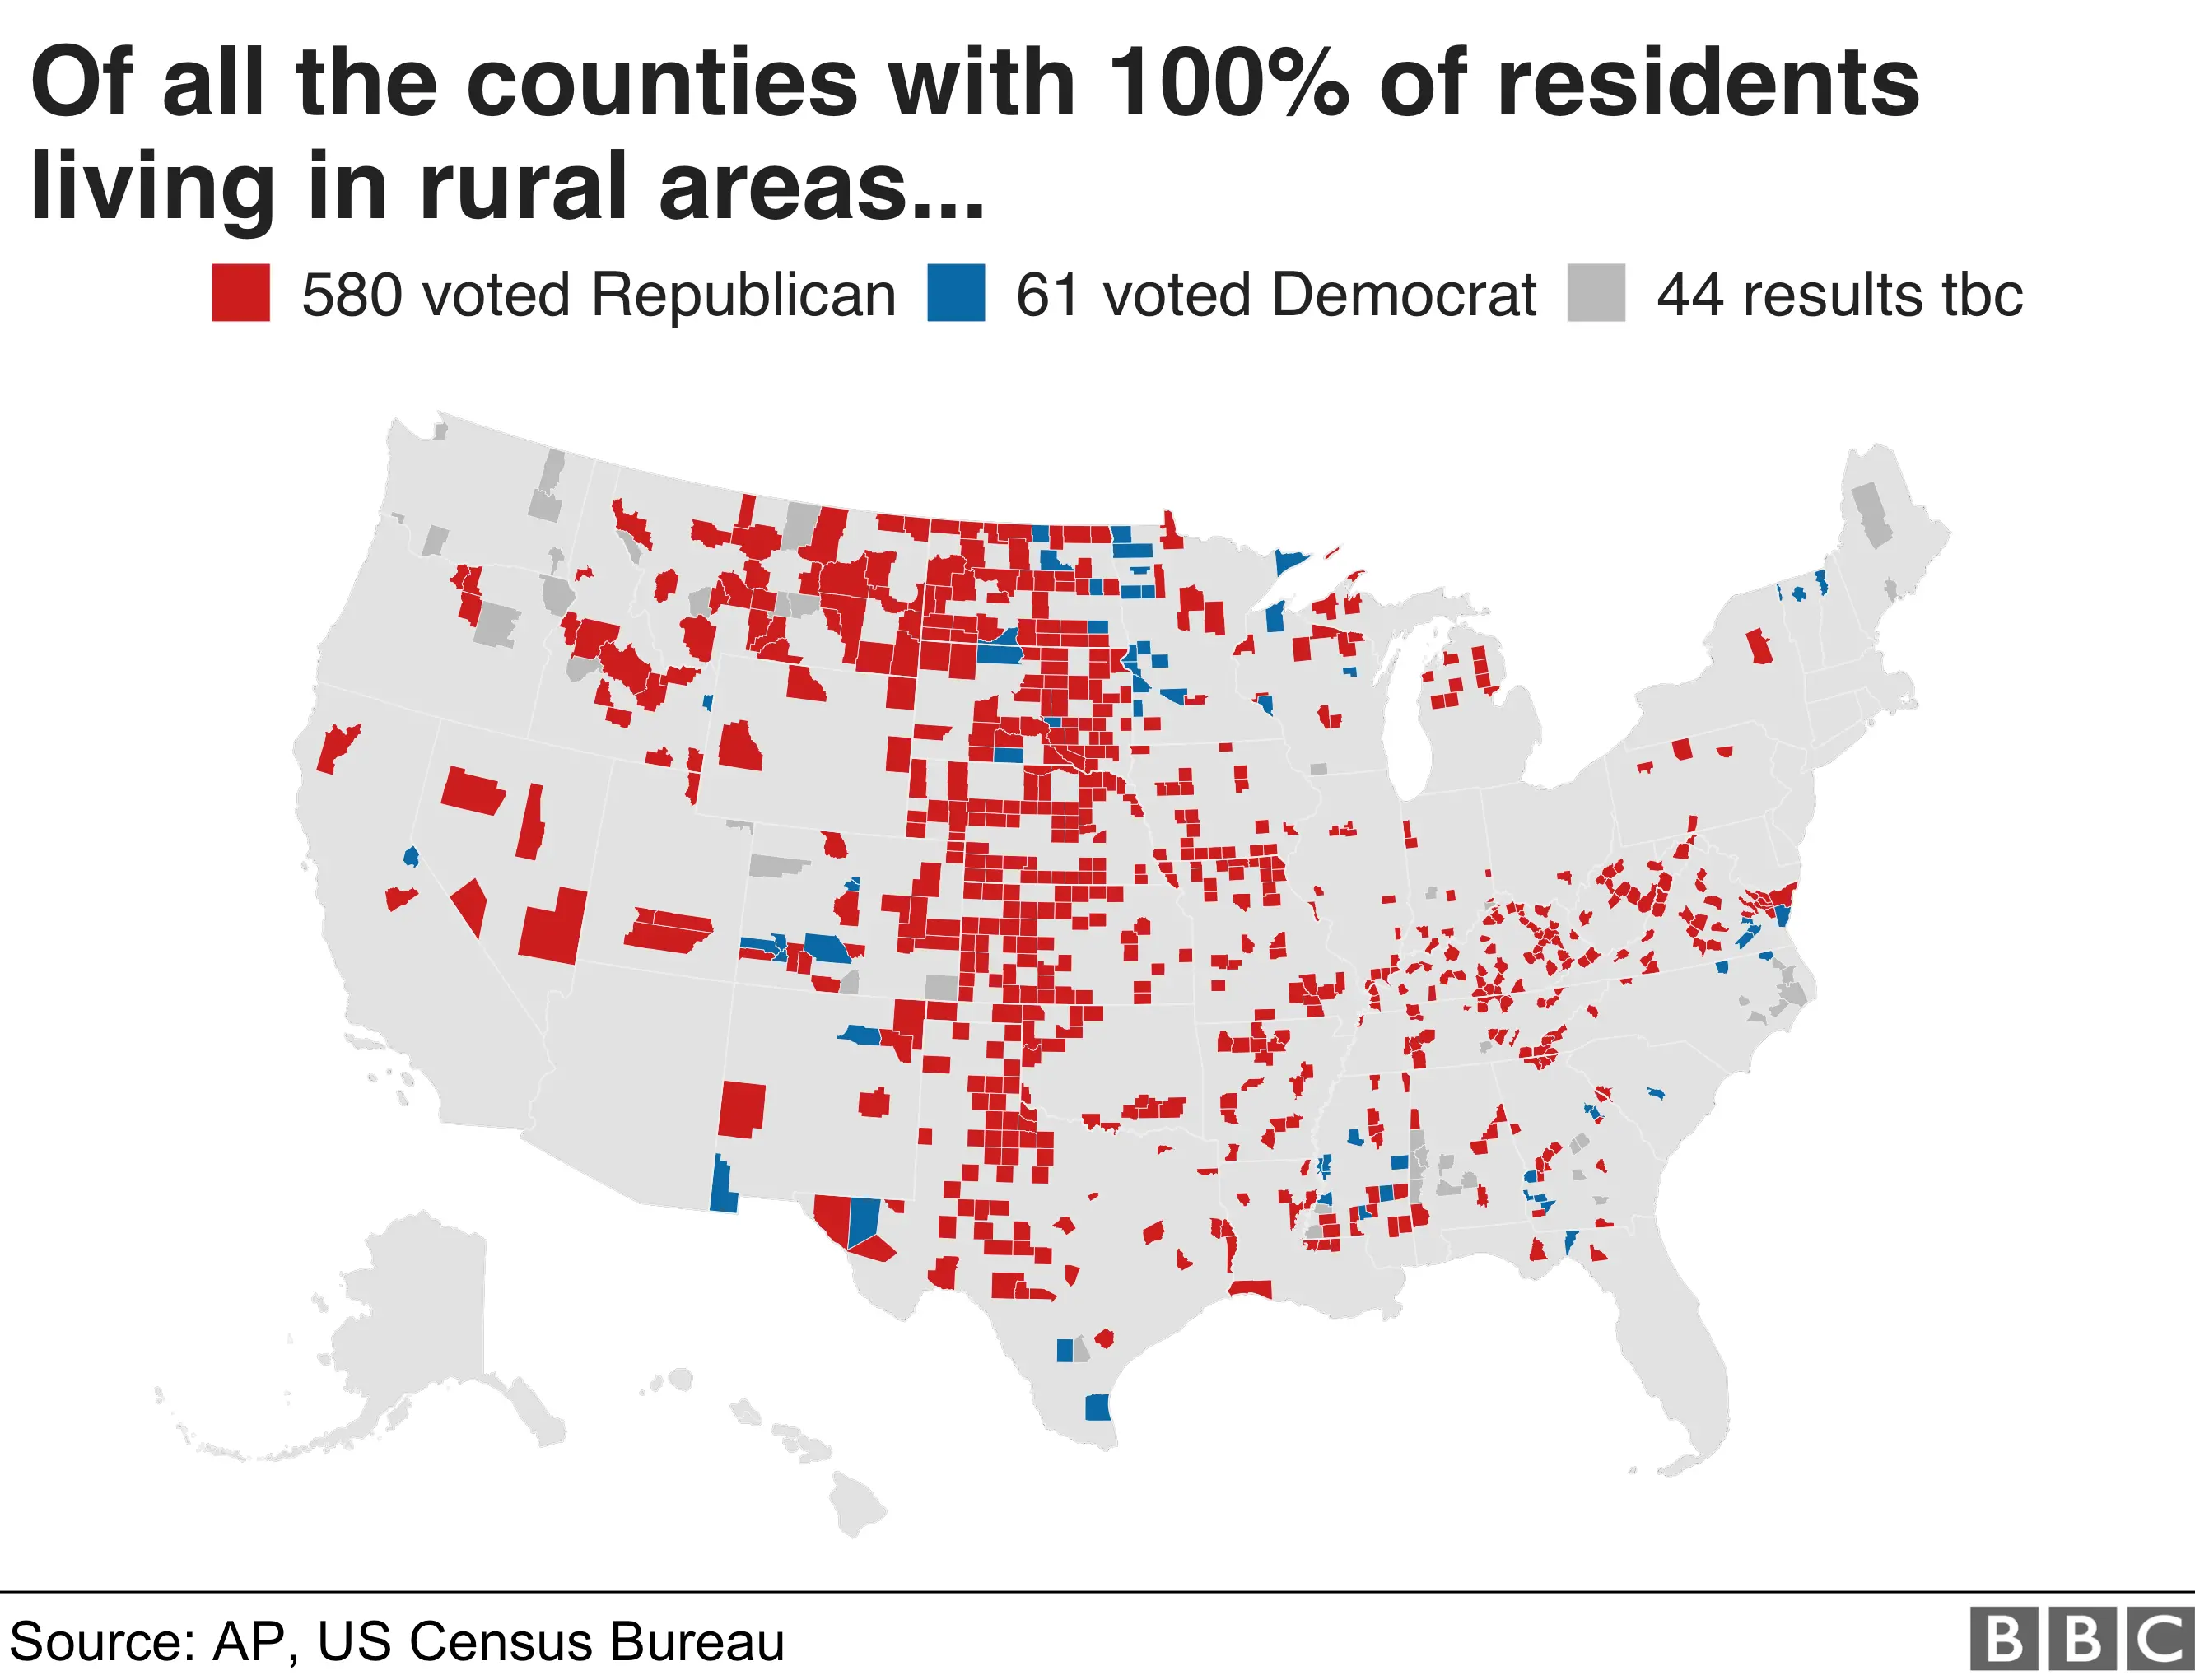
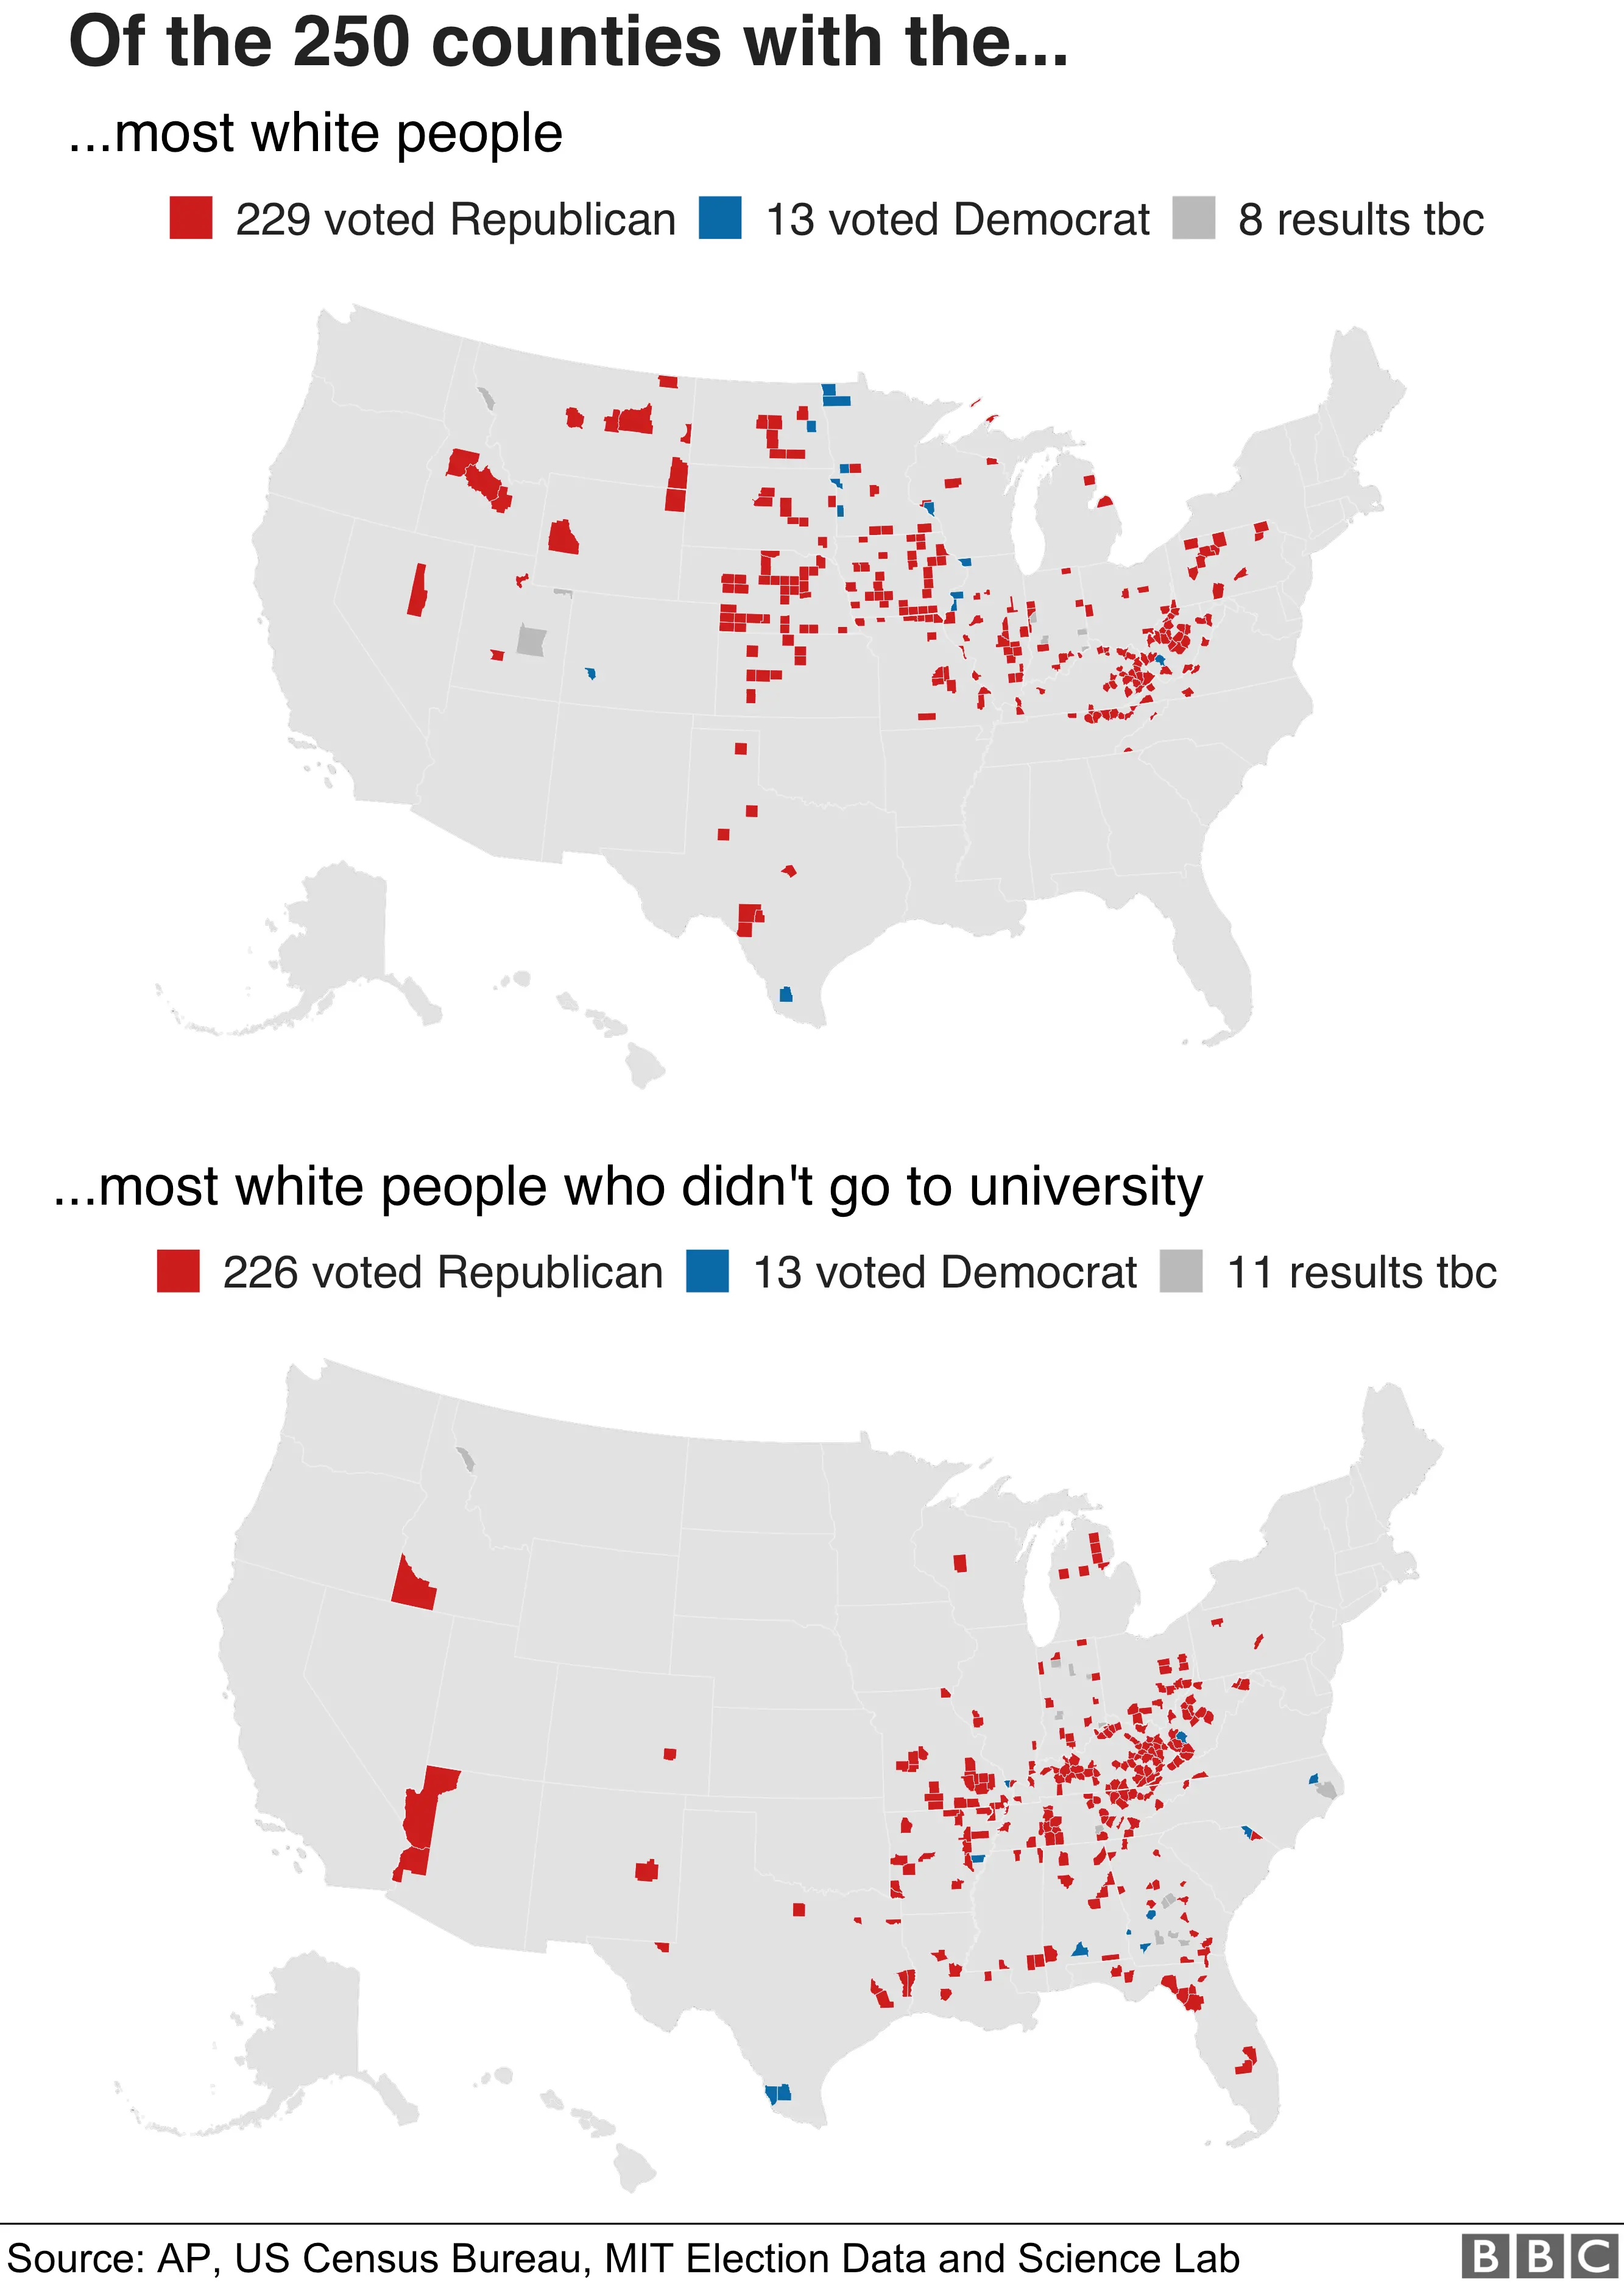
President Trump's core constituencies of white working class voters also appear to have turned out for the party in House races.
Produced by Daniel Dunford, Tom Calver, Will Dahlgreen, Maryam Ahmed, Nassos Stylianou, Ed Lowther, Clara Guibourg, John Walton and Irene de la Torre Arenas.
