US mid-term elections 2018: Can we tell yet who has the edge?

 Getty Images
This is it. After primaries, debates, countless polls, months of campaigning and endless speculation, the US mid-term elections are almost here. In some states, early voting has been going on for weeks and turnout has surpassed previous records for non-presidential years.
At this point Democrats are cautiously optimistic of their chances to take back some legislative power. Congresswoman Nancy Pelosi has gone so far as to flat-out state that her party will win control of the House of Representatives.
Such an outcome would have immediate and drastic implications for the president's ability to advance his political agenda and Democratic oversight of his administration.
The "mid-term wave" - a sweeping electoral triumph that reshapes the national political map - is a recurring phenomenon in US politics. Is one about to crash on Republicans in Washington?
What is a wave?
For the purposes of this analysis, a mid-term wave is where one party picks up a combination of more than 20 seats in the US House of Representatives and the Senate.
That's happened eight times in the last 70 years, notably in 1994 (a Republican wave against Bill Clinton) and 2010 (one against Barack Obama).
Today, the Republican Party is near a modern-day high in seats in the House of Representatives, with a 241-to-194 seat majority, so it could be poised for a tumble.
The Senate terrain may be friendlier for Republicans, with Democrats defending 10 seats in states Mr Trump won in 2016, but this year's political atmosphere is such that an electoral storm could be brewing.
Democrats have the political wind at their back, but intervening events - like the fight over confirming Brett Kavanaugh to the Supreme Court - have the potential to shake things up.
What is the current state of play?
Here are the measurements - and the history lessons - that will give us clues.

1. Campaign fundraising
Money makes the (political) world go round.
Levels of cash pouring in for candidates, parties and independent groups are an indication of electoral muscle for advertising, organisation and get-out-the-vote efforts.
They're also a reflection of the enthusiasm of each side's donor base.
There's one component of campaign fundraising that tracks particularly closely with every wave election in the last 25 years, a period during which the role of money in political campaigns skyrocketed.
In the Republican wave of 1994, individual donations to House candidates - which are limited under campaign finance law - tilted toward Republicans. The party then took control of the chamber for the first time since 1955.
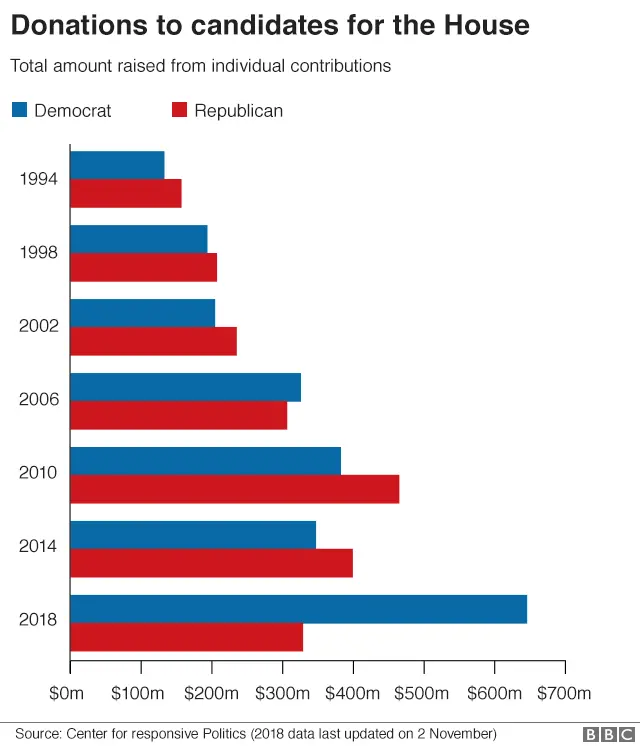

In 2006, the fundraising advantage flipped to the Democrats, as did control of Congress. Four years later, Republicans were back in the money - and back in charge of the House. In 2014, they built their biggest majority there in 83 years and won control of the Senate, as well.
"In mid-term waves, long-time incumbents can get kind of caught flat-footed when they're faced with a well-funded, competitive race," says Geoffrey Skelley of the University of Virginia Center for Politics.
2018 outlook:
What was once a remarkable fund-raising advantage for Democratic House of representative candidates has become an astounding one. The latest figures show them more than doubling the Republican amount of contributions from individual donors. As of 2 November, they have brought in $649m (£500m), against "only" $312m for Republicans.
Democratic enthusiasm is translating into open pocketbooks - and a rising financial tide is lifting all Democratic ships.
It's not all gloom and doom for Republicans, however. They have plenty of deep-pocketed donors pouring their own money into independent expenditures, and the Republican Party itself is flooding money into key races across the US.
When it comes to grass-roots enthusiasm and small-money donors, however, all the energy and excitement is clearly coming from the left. In the past month alone, Democrats have hit the accelerator and left the Republicans behind in a cloud of dust.

2. Presidential popularity
Mid-term elections are said to be a referendum on the incumbent president.
When presidents are unpopular, voters take out their frustration on their party in Congress.
If the chief executive is riding high, the party is rewarded (or, at least, not excessively punished).
A look at the Gallup presidential approval poll over the last 60 years tends to bear this out.
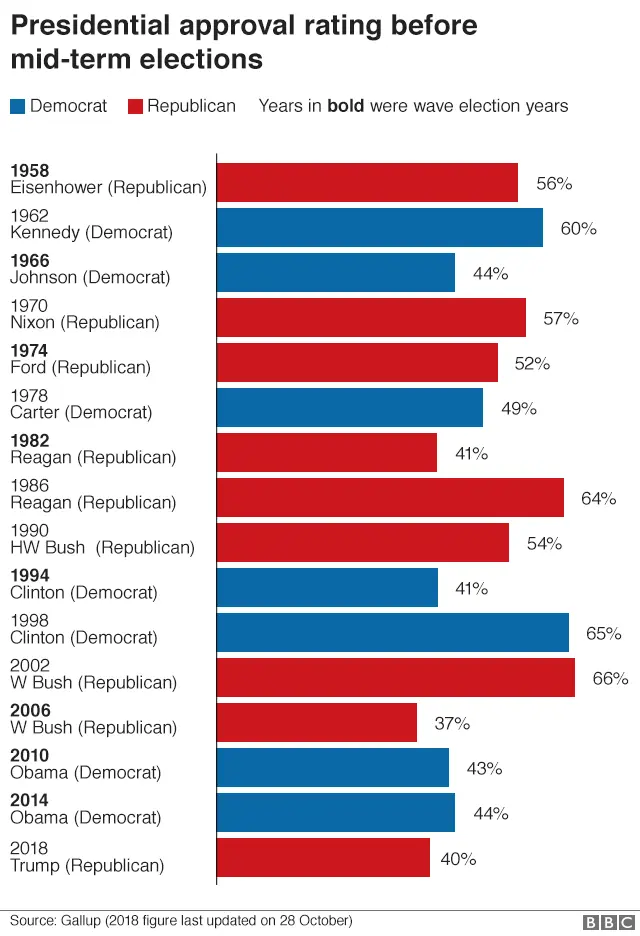

Every time a president faced a net-negative rating in the month before the mid-terms - Ronald Reagan in 1982, Bill Clinton in 1994, George Bush in 2006 and Barack Obama in 2010 and 2014 - it meant lights-out for his party at the ballot box in November.
The exceptions are also enlightening.
Gerald Ford was plus-24 in October 1974, but his numbers - following his controversial pardoning of Richard Nixon the month before - were poised to take a nosedive, declining 15 points over the next three months. Democrats gained 48 seats in the House and five in the Senate - what would be known as the "Watergate Class" of Congress.
Lyndon Johnson was around the break-even point in 1966, but unease about the Vietnam War and civil rights unrest, combined with his party's inflated congressional numbers after a big victory two years earlier, set Democrats up for a tumble.
2018 outlook:
Donald Trump's approval ratings have been remarkably stable, given the tumult of his first year-and-a-half in office. He didn't have much of a "honeymoon" period following his election, so there haven't been many sharp changes.
At the end of August, the president stood at 40% approval. On the eve of the mid-term elections his approval is… 40%
That's not a good sign for Republicans. The president has defied political gravity in the past, but his unpopularity could be a weight that sinks his party on Tuesday.

3. The generic ballot
This involves asking people simply which party's House candidate they would support in the election.
There are 435 individual House of Representatives races in every mid-term election, meaning at least 870 candidates from the two major parties plus a handful of prominent independents and third-party politicians.
Each race is unique, every constituency has its own particular interests, and each congressional district has a demographic identity as unique as a fingerprint.
It therefore seems implausible that the collective outcome of all those races could be boiled down to a simple poll asking whether a voter would prefer a nameless Democrat or a faceless Republican.
The generic ballot question, however, has proven to be a remarkably accurate predictor of mid-term election prospects for the two major parties.
"The national generic ballot picks up the national political climate," says Alan Abramowitz, a political science professor at Emory University who has crafted an election prediction model based largely on the generic ballot polling numbers.
"I view it as a measure of the political mood of the electorate."
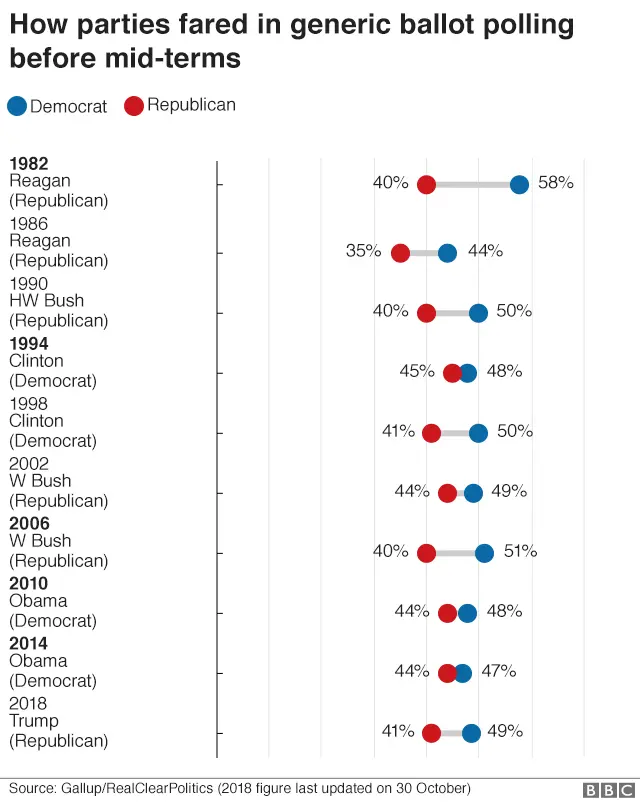

In 1958, 1982 and 2006, the Democratic generic ballot advantage ballooned before the party's wave-election victories.
When the Republican waves of 1994, 2010 and 2014 swept through, the Democratic advantage narrowed to low single digits (or even, at times during the election run-up, disappeared entirely).
This year, Abramowitz says, the tipping point for Democratic control of the House sits around a seven-point generic ballot advantage. A lead bigger than that, and a wave could be on the horizon.
2018 outlook:
The Democratic generic ballot lead has shifted over the course of the past year.
In the late spring it narrowed to the point that it appeared Republicans were in excellent shape for November. By mid-September, however, the Democratic lead approached double-digits. That trend tailed off a bit, but the current eight-point margin is on the lower edge of where it has to be for a blue wave, even if it falls short of a tsunami.

More on the US mid-terms

4. The economy
Donald Trump and his fellow Republicans are pushing positive economic numbers as a reason why they deserve another two years of unified control in Washington.
Historically, however, a growing economy is no guarantee of success for the president's party.
In 1994, when the governing Democrats ceded Congress, the economy was expanding at more than 4%, although unemployment was a bit higher than the current mark, at 5.8%.
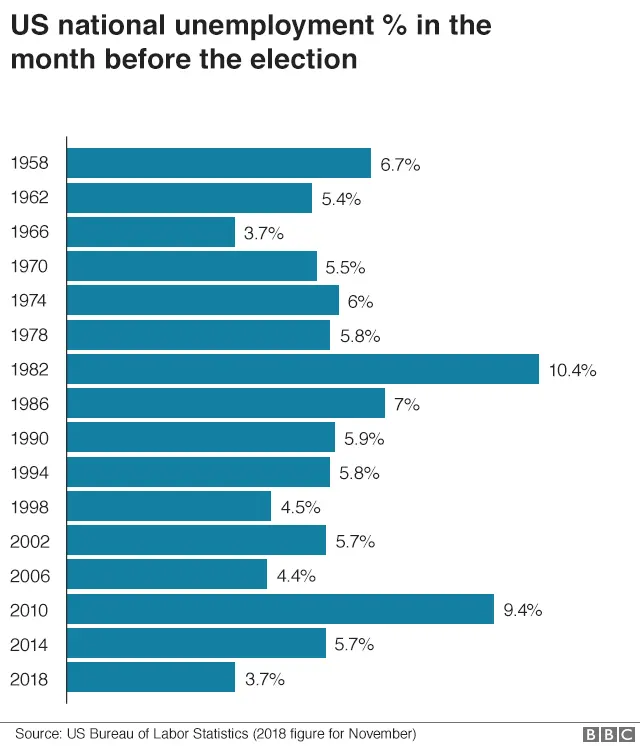

In other wave years, 2006 and 2014, the economy wasn't in bad shape either.
A struggling economy, on the other hand, can be a death sentence for the incumbent party's mid-term prospects.
In 1958, Republicans in Congress faced a bloodbath largely due to that year's recession, which included a modern-record -10% first-quarter GDP contraction.
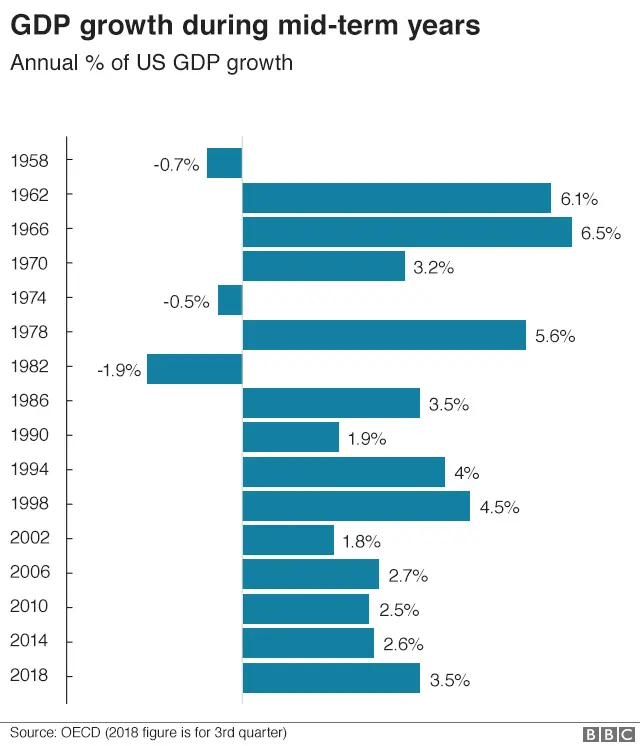

Negative growth in 1974 and 1982 also probably contributed to Republican losses those years.
"You'd rather have a strong economy than a bad economy, but it doesn't mean you're going to escape the wrath of voters," says Abramowitz.
2018 outlook:
Third-quarter gross domestic product growth is down a bit, after the second quarter hit 4.2%. Combined with unemployment at a 49-year low and signs of wage growth, however, the economic numbers are undoubtedly good.
Mr Trump has decided to make immigration control his closing argument to mid-term voters - to the dismay of some Republicans who would prefer he focus laser-like on the robust economy. If history is a guide, however, the president may be right to look for a different issue, as a growing economy is no guarantee of electoral success.


5. Political retirements
Set aside all the poll numbers, economic figures and expert analyses.
Who has their finger on the pulse of the political climate better than anyone? Probably the politicians themselves.
They're the ones whose names are on the ballots, and they're the ones who could be out of a job if a wave hits.
Facing the prospect of embarrassing electoral defeat, some politicians may opt to ease into early retirement or get a head-start on colleagues searching for post-public-service gainful employment.
"We know historically that open seats are more difficult to defend," says Skelley. "And because they're more difficult to defend, that gives the party that doesn't control them a better shot."
A look at modern retirement trends shows a mixed picture. The retirement figures in 2010 gave little hint of the carnage in store for Mr Obama's party.
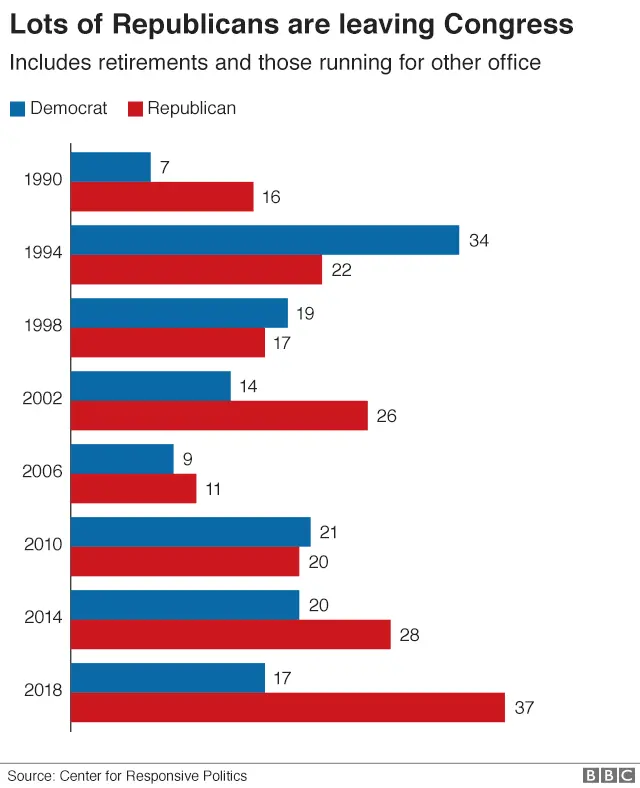

In 1994, however, a surge of Democratic retirements may have foreshadowed big Republican gains that autumn.
2018 outlook:
If 1994's retirements were a harbinger of doom for Democrats, 2018's numbers could spell trouble for Republicans.
Several key committee chairs and Speaker of the House Paul Ryan have already joined what's become a modern record for retirements from a majority party - a telling sign that they think Republicans may not be a majority much longer.
Several incumbents - on the left and right - also were forcibly retired, as they lost primary races to grass-roots challengers.
That could be another indication of an anti-incumbent mood in the electorate that, because there are more Republicans running for re-election than Democrats, could help fuel a Washington power shift.
Micah Luxen contributed to this report.
