Covid in Wales: Case rate below lockdown trigger and lowest since September
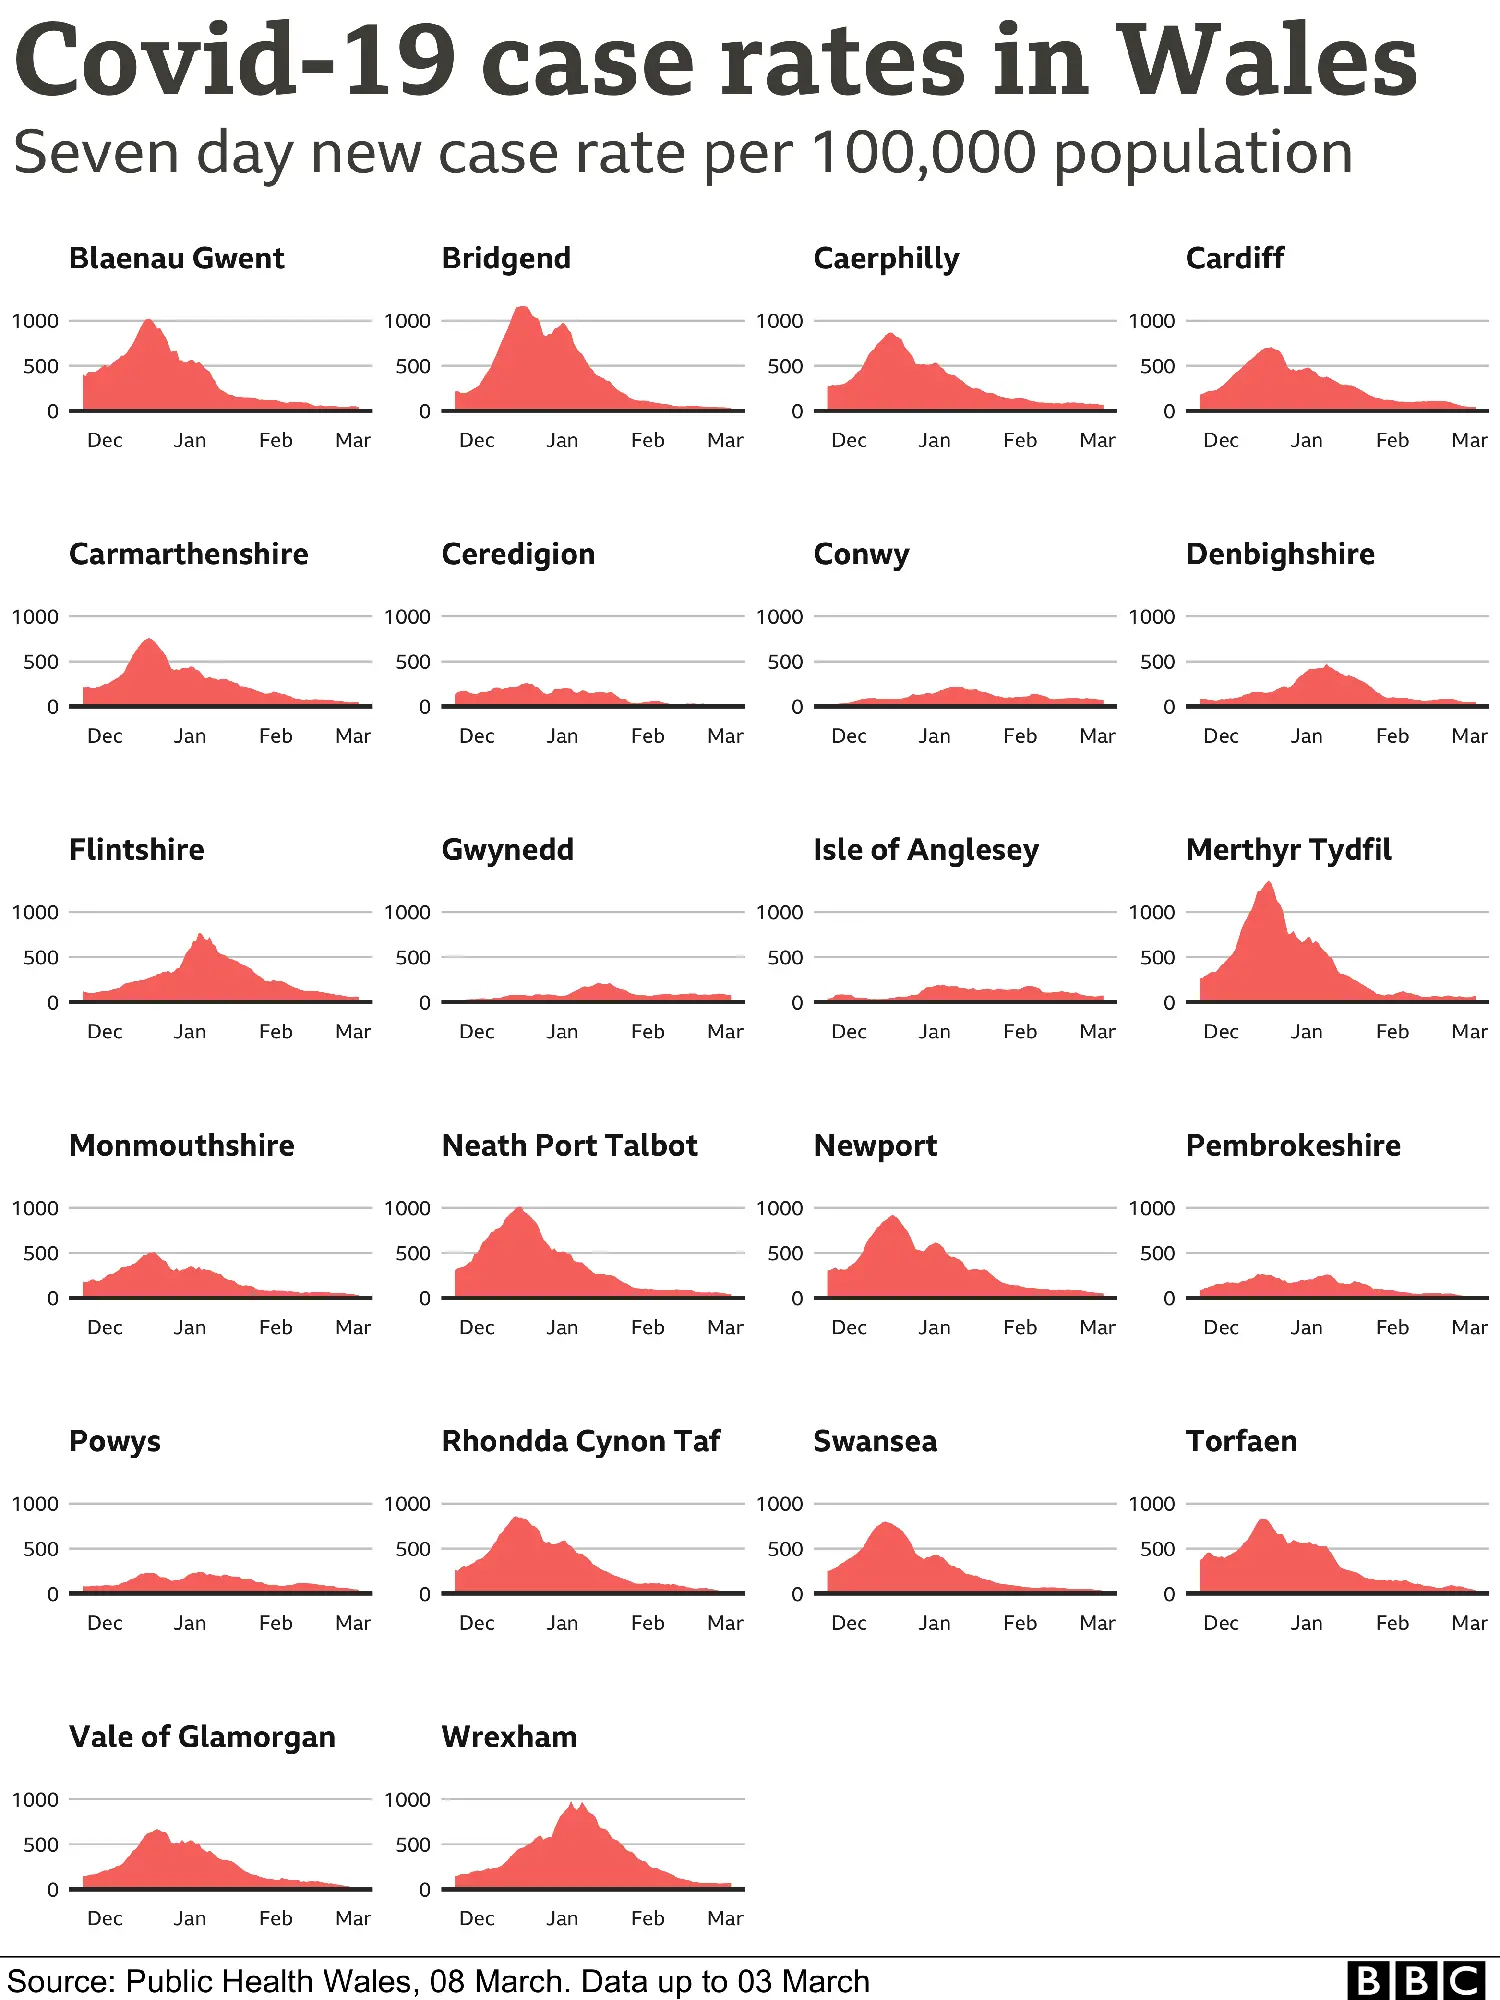
Both Covid-19 case rates and positivity rates for Wales have now fallen below "trigger" figures used for putting areas into lockdown restrictions.
First Minister Mark Drakeford has said stay at home rules could be revised when lockdown measures are reviewed this week and announced on Friday.
It comes as health chiefs reported no Covid deaths in Wales on Monday.
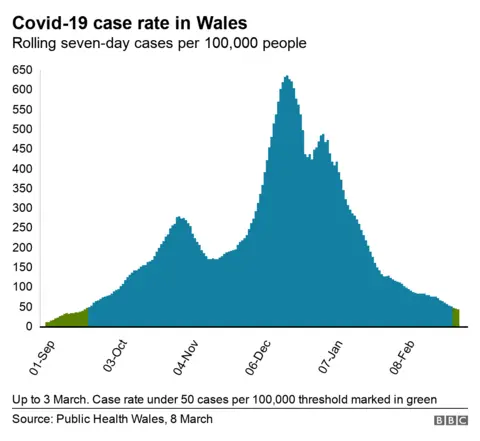
Wales' overall Covid case rate is 45 cases per 100,000 people for the last week - below the 50 cases threshold.
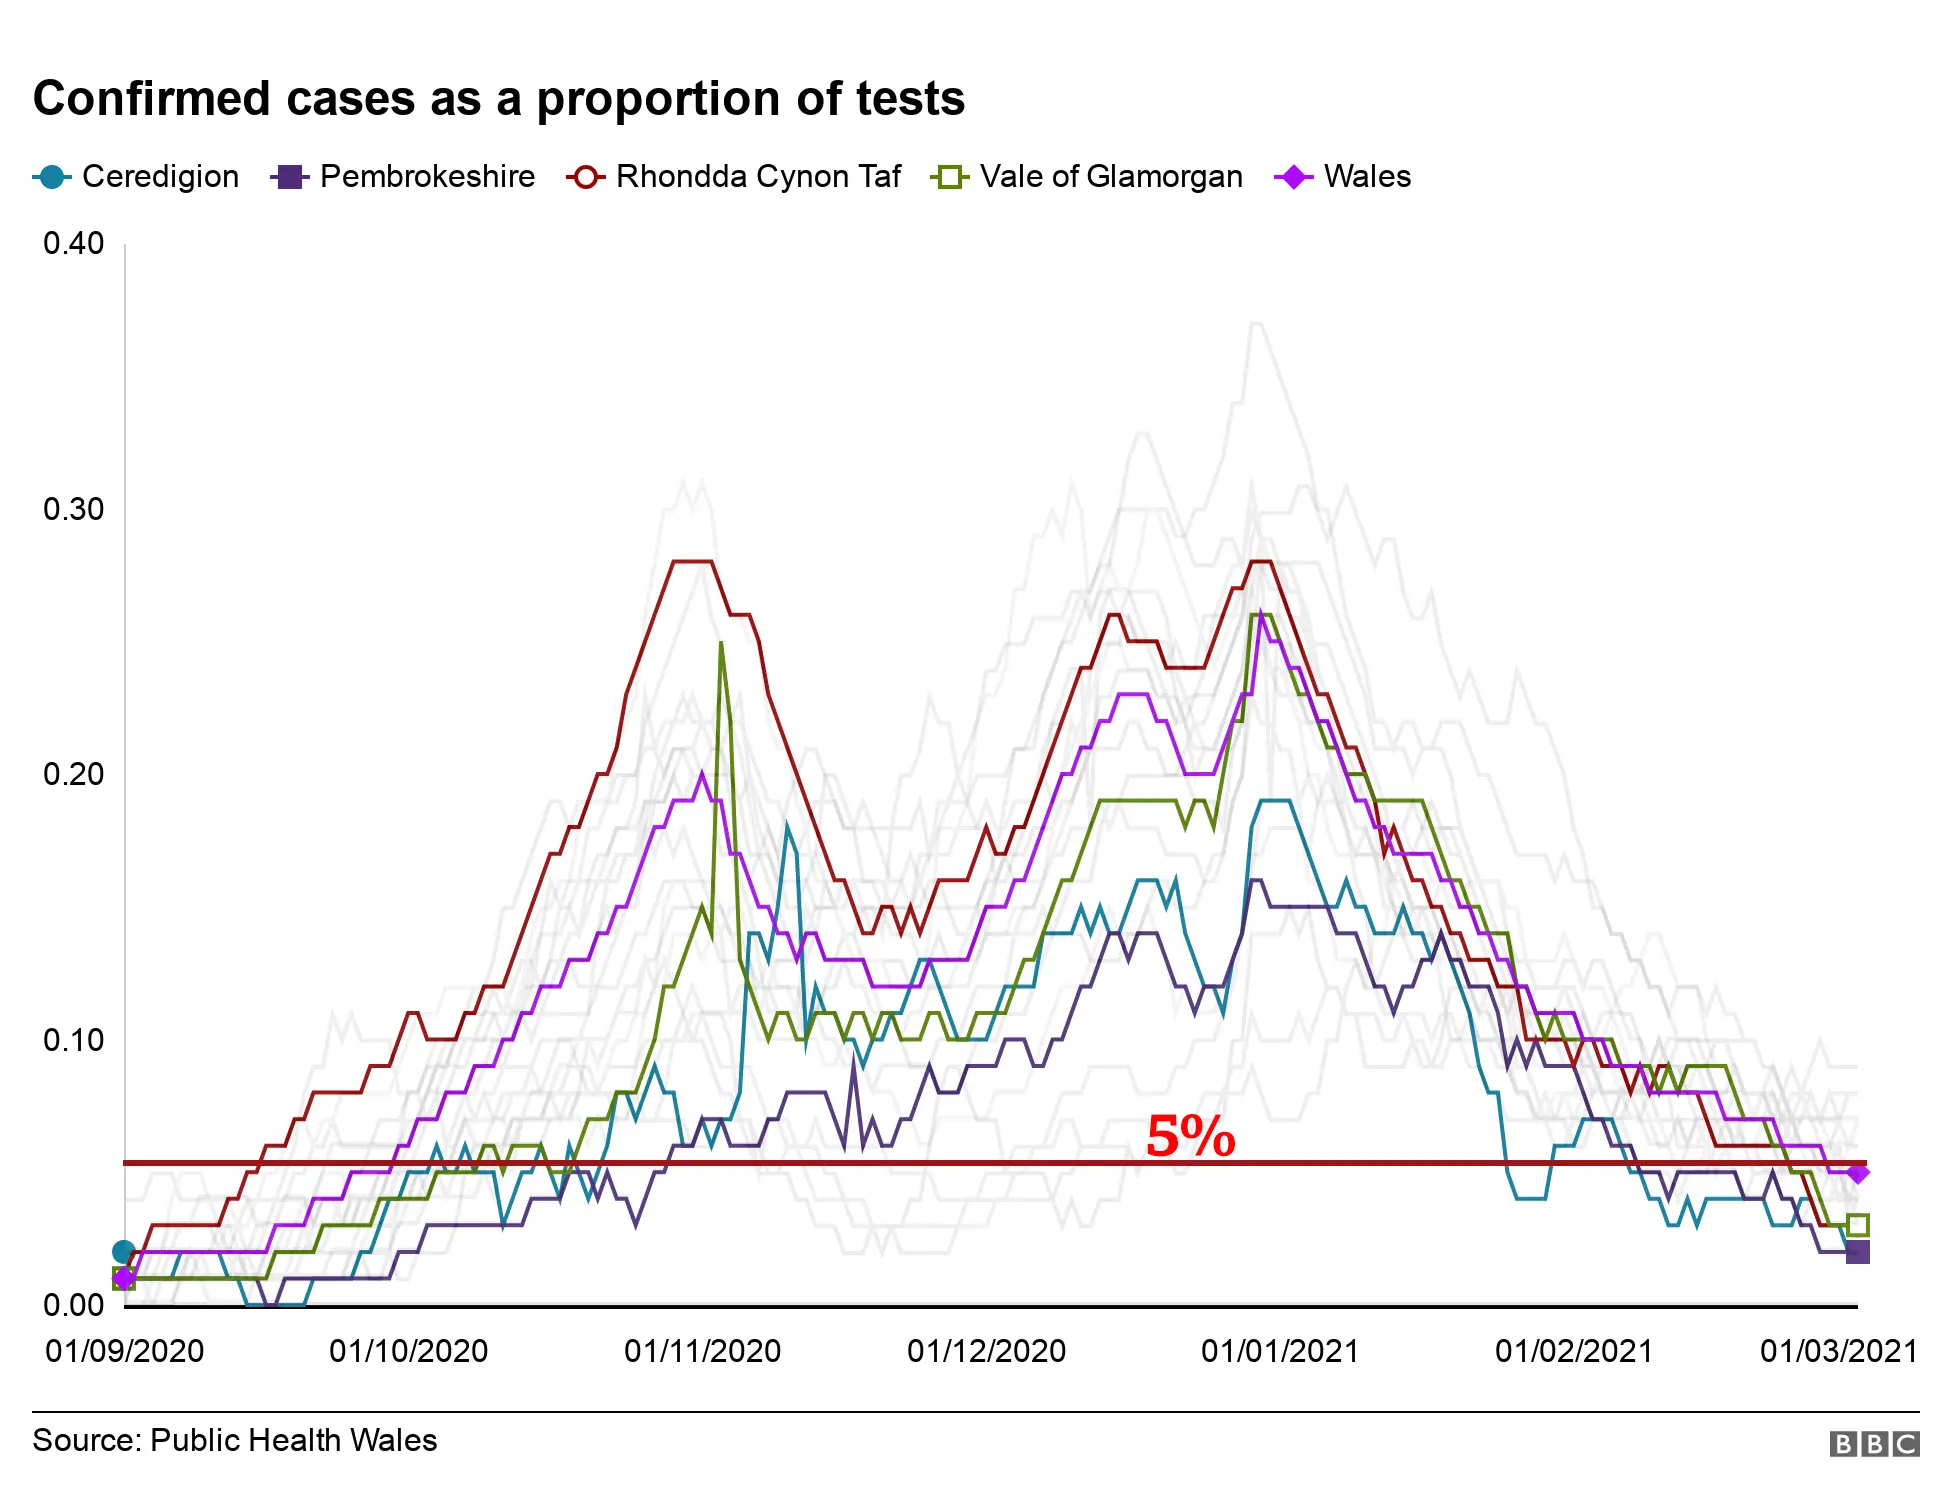
The proportion of Covid tests coming back positive has also fallen below a 5% threshold for the first time since September.
But Public Health Wales warned of a possible lag in reporting deaths, especially after the weekend, for the zero daily figure - which has not been that low since September.
Dr Giri Shankar, incident director for the Novel Coronavirus (COVID-19) outbreak response at Public Health Wales, added the dashboard is designed to be a "rapid reporting tool which is subject to ongoing reconciliation" and that "official data is provided by the Office for National Statistics".

What does the case rate show?
The overall case rate for Wales is at its lowest point since 18 September.
The figure of 50 cases per 100,000 is seen as a so-called "circuit breaker" for bringing in restrictions and so getting areas below it, a sign-post on the road out of lockdown.
There are now 15 of Wales' 22 local authority areas under this figure.
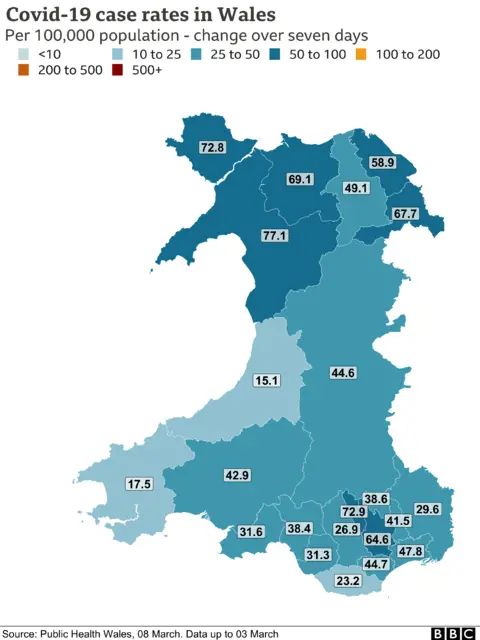

Gwynedd remains the local authority with the highest case rate for a seven day period - 77.1 cases per 100,000 people.
This is followed by Merthyr Tydfil (72.9) and Anglesey (72.8).
The lowest case rates are seen in the Vale of Glamorgan (23.2), Pembrokeshire (17.5) and Ceredigion (15.1).

Positivity rate at lowest point since September
The proportion of tests which are positive is 4.8% in Wales, the lowest point since 23 September.
The World Health Organisation suggests a 5% threshold, which needs to be sustained, as part of requirements to come out of restrictions.
There are now 13 local authority areas below 5% - with Ceredigion, Pembrokeshire, Rhondda Cynon Taf and Vale of Glamorgan below 3%.
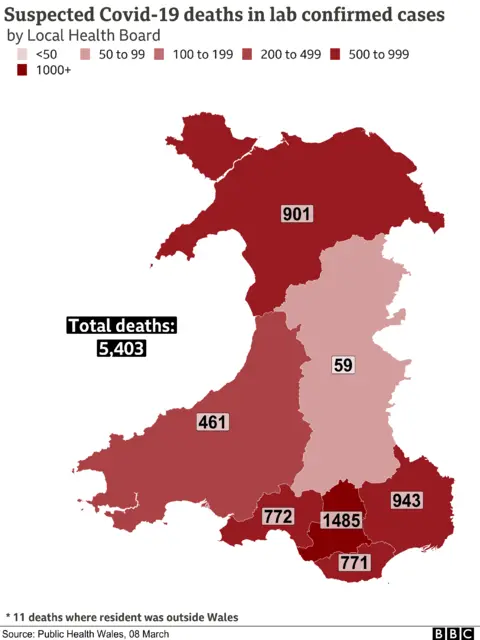

There were no further deaths reported on Monday, leaving the total so far during the pandemic involving lab-tested cases, at 5,403.
It is advised to look at the rolling 7-day daily average for deaths as reported by Public Health Wales and account for the lag in reporting, so waiting until we know when the deaths occurred.
By 3 March, there was an average of nine deaths a day - this is the lowest number since 24 October.
It is down from a peak of 47 daily deaths on 3 January. There were 57 deaths occurring on 1 January, the highest daily figure in the pandemic.
How many people have been vaccinated?
A total of 998,296 people have now received at least a first dose of a Covid vaccine in Wales.
Of those, 183,739 have had their second jab.

Dr Giri Shankar said: "The Welsh Government has announced that the revised vaccine strategy will mean that every eligible adult in Wales will be offered a first dose by the end of July.
"In addition, adults with severe or profound learning disabilities, and those with any mental illness that causes severe functional impairment, will be invited for vaccination as part of the JCVI priority group six, and the Welsh Government has published guidance on identifying eligible individuals in these groups and how to support them to take up their vaccine offers.
"We encourage everyone, whatever their background, socio-demographic and ethnicity, to have the vaccine when they are offered it.
"We also stress the importance of seeking information from a trusted source such as Public Health Wales, the Welsh Government, local health board or GP."
Why are there different death figures?
The latest Office for National Statistics (ONS) figures show Covid was mentioned on 7,458 death certificates, up to 19 February.
This gives a bigger picture and includes deaths where Covid is either confirmed or suspected by doctors and covers deaths in all settings, including care homes, hospices and people's homes.
The ONS figures show the weekly total has fallen for the fifth successive week.
When looking at the number of all deaths and comparing them over a period of five non-pandemic years to what we might normally expect to see, this shows 5,411 deaths above the average.
Find out how the pandemic has affected your area and how it compares with the national average:
The postcode search has been updated to replace data for health boards in Scotland with data for local councils. In England, data for county councils has been replaced with data for district councils. Figures for boroughs and unitary authorities remain unchanged.
PHW figures only record deaths which have a confirmed Covid-19 diagnosis, backed up by a laboratory test, and mostly involve hospital deaths.
ONS takes a little longer to report deaths because it collates details of death registrations. In about 90% of cases, it is the underlying cause of death.

- A SIMPLE GUIDE: What are the symptoms?
- IN-DEPTH: Coronavirus pandemic
- VACCINE: How will the UK deliver the jabs?
- IMMUNISATION: Which Covid vaccine is best?

