Wales lockdown: How Wales reached a Covid firebreak - in six charts
How have we got to the "firebreak" local lockdown in Wales?
Health officials and ministers have been watching closely how Covid-19 has been progressing before reaching the decision.
Here are some of the factors they have been considering - in six charts.
1 How has Covid-19 spread across Wales?
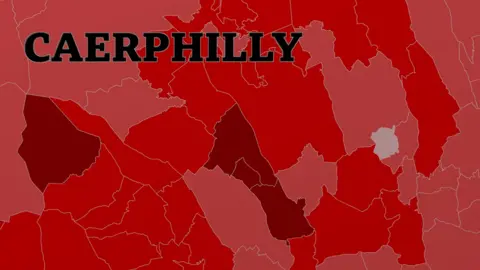
The video above shows a map of the case rate across the nation over the past two months.
You can watch the rolling seven-day positive cases per 100,000 for each county in Wales - and how that rate has increased in different areas.
The figures are based on Public Health Wales data, issued daily.
2 How have cases been increasing?
Allow X content?
This shows how the number of positive cases have grown in total - but not always at the same speed, depending on where you live.
The maxim "west is best" might apply here but even Ceredigion and Pembrokeshire, the least affected areas, have seen a rise.
3 Local lockdowns have not been enough

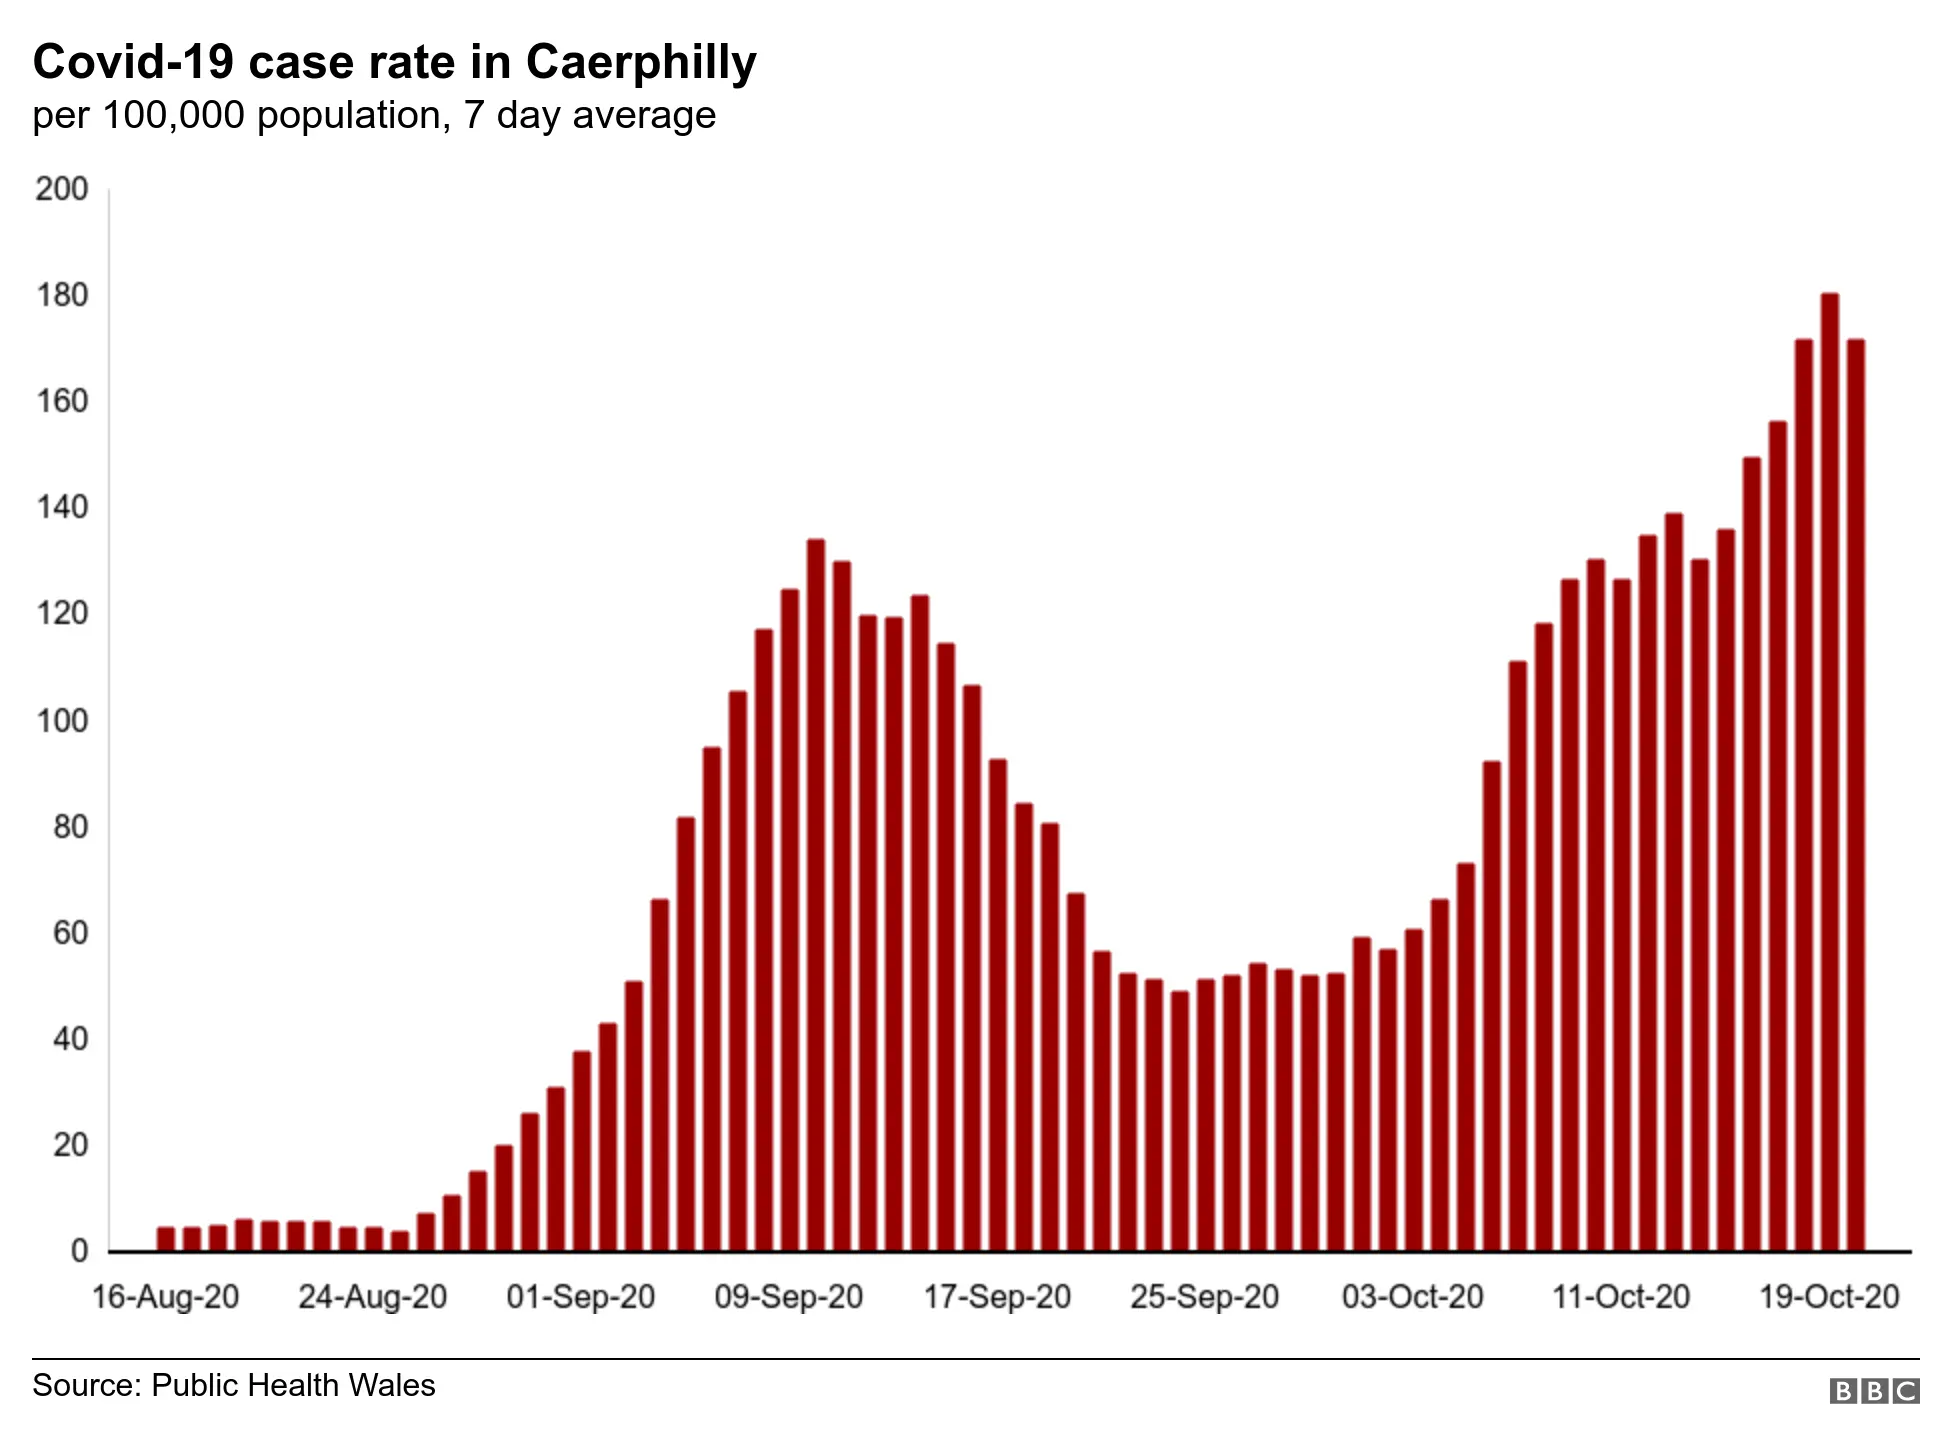
Caerphilly was the first area to go into local lockdown, more than six weeks ago. At the time, its case rate doubled within a few days and reached 117 cases per 100,000 people - the highest rate in Wales and one of the highest in the UK.
It peaked within a few days and started to fall back, to 50 cases per 100,000. A month into lockdown, it began to rise again. The figure this week is back up to where it was at the start of lockdown.

Looking within the county, the case rate in recent weeks was particularly high in Abertridwr and Senghenydd - the Aber valley west of Caerphilly itself - although that has since dropped back. The local hotspots in the past week are in the Rhymney valley, around Hengoed and Ystrad Mynach.
The county has also seen a cluster of positive tests among workers at the Peter's pie factory in Bedwas.
The council leader said it did not mean that local lockdown had not worked - but that the measures had mitigated what might have been even worse.
Philippa Marsden said: "I'm sure you can imagine how worse the situation would be if we hadn't introduced the restrictions when we did. It is clear from the UK-wide data that all our efforts have prevented the kind of very large spikes of infection we are seeing elsewhere in the UK."
4 Student areas have shown particular clusters
Allow X content?
Even within local areas we can see how some areas have particular hotspots, including in student areas.
Bangor in Gwynedd went into its own local area lockdown, associated with a spike in student cases.
Similar patterns can be seen in Cardiff, with more cases in those parts of the city where hundreds of students have tested positive, and to a lesser extent in Aberystwyth.
Before the Wales-wide "firebreak" lockdown, Aberystwyth had not been under any extra restrictions, and the university said its total cases between September 4 and October 23 numbered 37.
5 R number - it has risen again
Allow X content?
Another key area, which health officials and ministers have been looking at is the reproduction or R number. This measures infection and how it reproduces. Anything above 1 and it means more people can be infected.
The R number is currently between 1 and 1.4. Back in April it was 2.8 and you can see how it dipped over the summer - with infections so low that the R number itself became unreliable to use as a guide.
6 More patients are in hospital
Allow X content?
The number of patients in hospital with Covid-19 is going up. It is not up to the peak of the pandemic but it is already at two-thirds of the numbers we saw back then.
There has been an expectation that if there are rising cases in the community among older and more vulnerable people, then these will start to show up in hospital.
Hospital admissions are also rising, while critical care beds are now above the normal capacity. First Minister Mark Drakeford said the firebreak was "vital" to prevent hospitals from being over-run.
