Covid in Scotland: Are cases high in your community?
 BBC
BBCDo you know how Covid-19 is spreading in your neighbourhood? Well, Public Health Scotland is now providing more detail about the progress of the pandemic.
The organisation had initially declined to make public the data behind its interactive map, due to concerns over low numbers and patient confidentiality. This now appears to have been solved by not disclosing data where the number of cases is fewer than three. These areas are marked as white on the map.
Up until recently, we only knew coronavirus case rates by health board or local authority. These areas can contain tens or hundreds of thousands of people. So by having more granular data at the "intermediate zone" level it allows us to really pinpoint hotpots.
There are 1,279 of these zones in Scotland and each holds between 2,500 and 6,000 residents.
Public Health Scotland's interactive dashboard had been displaying this data, but it was not allowing journalists like me to have access to the raw figures.
Now that PHS has decided to publish the raw data I can calculate the actual case rates per 100,000 people across every Scottish neighbourhood.
So what did I find?
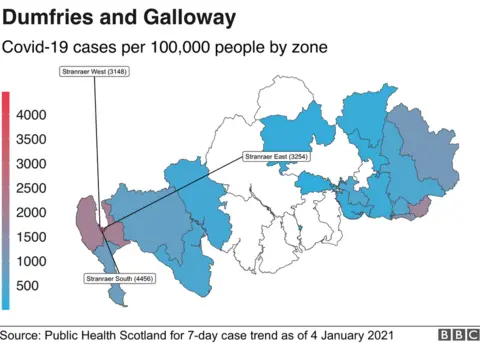
Looking at Dumfries and Galloway, we can see that the highest rate is actually much higher than 400 with 4,456 per 100,000 people in Stranraer South having tested positive over the seven-day period leading up to 4 January.
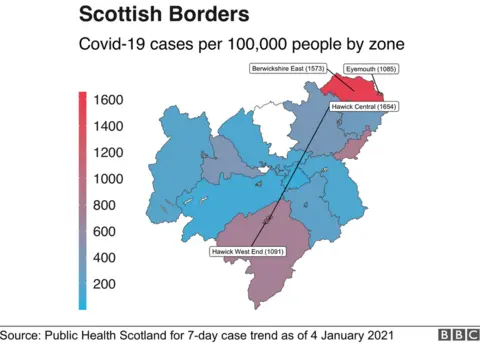
In Scottish Borders, we can see rates as high as 1,654 and 1,573 per 100,000 in Hawick Central and Berwickshire East.
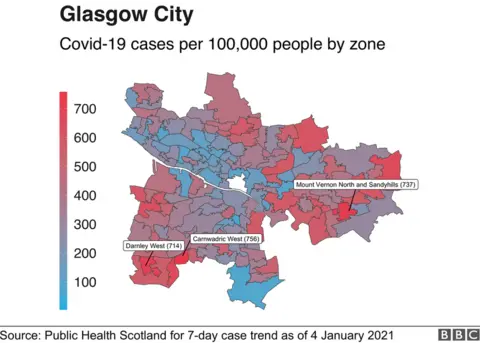
And in Glasgow, we can see there have been 756 cases per 100,000 people in Carnwadric West.
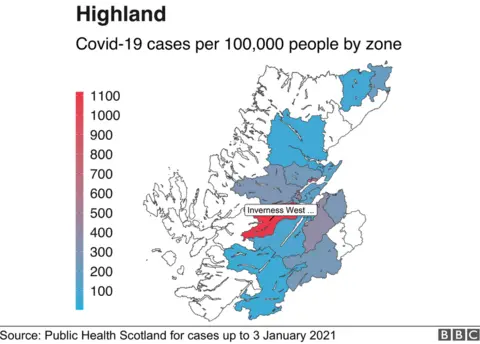
Remember, the white areas of the map indicate that the number of cases is fewer than three. Here, there are vast rural and coastal areas where figures are low.
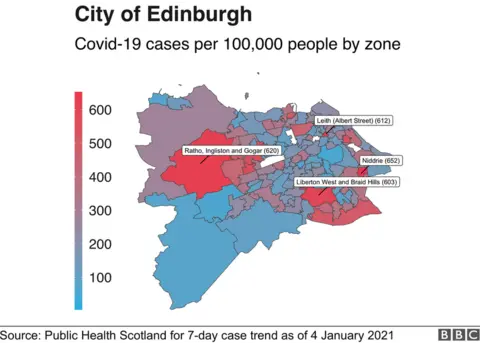
A few areas in the capital are more than 600 cases per 100,000 - these include Leith and Niddrie.
