NI survey suggests 50% neither unionist nor nationalist
 Getty Images
Half of the population of Northern Ireland describe themselves as "neither unionist nor nationalist", according to new research.
The Northern Ireland Life and Times Survey on social attitudes was conducted by Ark, a 20-year-old initiative between Queen's University in Belfast and Ulster University.
Academics carried out face-to-face interview with 1,201 adults.
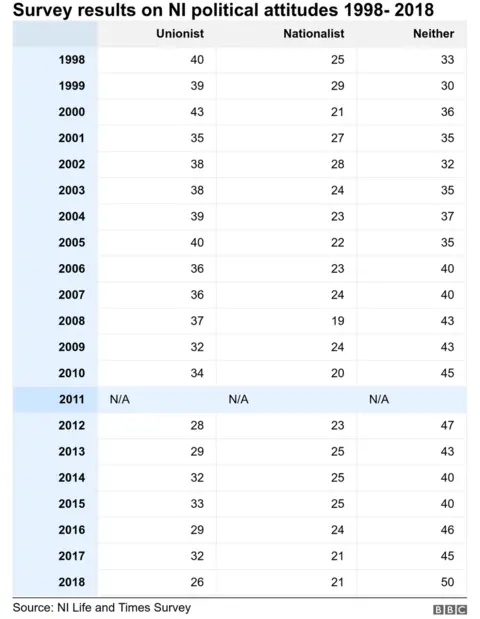
In 1998, 33% of people identified as neither unionist or nationalist.
But 20 years later that figure has reached 50%, according to the report.
 Charles McQuillan
As part of the wide-ranging survey, respondents were asked: "Generally speaking, do you think of yourself as a unionist, a nationalist or neither?"
Just over a quarter (26%) replied that they considered themselves to be unionists, while just over a fifth (21%) described themselves as nationalists.
The responses were also broken down by gender, religious background and age.
The results suggest women were more likely than men to describe themselves as neutral on the union - 55% of women said they were neither unionist nor nationalist, compared with 45% of men.
There was also a greater gender gap between unionists than nationalists.
 Charles McQuillan
There was only a 2% difference between the proportion of men and women who identified as nationalist (22% and 20% respectively).
Among unionists, there was a gap of eight percentage points between men and women, with 31% of men describing themselves as unionist, compared with 23% of women.
In terms of age, the group most likely to pick a side in the border debate was pensioners aged 65 and over, while people under the age of 45 were more likely to say there were neutral on the union.
The age group with the highest number of neutrals was the 35 to 44-year-olds' bracket, outstripping their younger 25 to 34-year-old peers by 10 percentage points.
The youngest age bracket (between 18 and 24 years old) also had a high number of neutrals, with 59% saying they were neither unionist nor nationalist.

However, in that age group young unionists outnumbered young nationalists significantly, with a quarter of 18 to 24-year-old respondents describing themselves as unionist, and just 14% who said they were nationalists.
At the other end of the scale, there was an even bigger political split between the over-65s.
Just under a fifth (19%) of pensioners described themselves as nationalist while more than twice that number (41%) replied that they were unionist.
Pensioners were also the least likely to say they were neutral on the union, with just 38% of over-65s falling into that category.
As regards religious background, exactly half of the Catholics surveyed identified as nationalist and more than half (55%) of Protestants identified as unionist.
People who said they had no religion were most likely to say they had no political affiliation to unionism or nationalism.
 Charles McQuillan
Almost two thirds (64%) of non-religious people said they were neither unionist nor nationalist, compared with 48% of Catholics and 42% of Protestants.
Queen's University academic Dr Cathal McManus, who jointly conducted the survey, said its findings "clearly suggest that political identity is in the process of change".
"The big question this raises, of course, centres on the political impact that this change brings about - or doesn't as the case may be," he added.
Dr McManus pointed out that, historically, "the 'neither' population have not necessarily rallied behind any specific political party".
"It seems that a political apathy may have set in within the 'neither' section of the population which, of course, both limits its political impact and ensures that the traditional nationalist/unionist narrative continues to define our political culture."
The Northern Ireland Life and Times Survey has been published almost every year since 1998, except in 2011, when it was cancelled due to uncertainty over its funding.
