Coronavirus: Four things stats say about the pandemic in London
 AFP
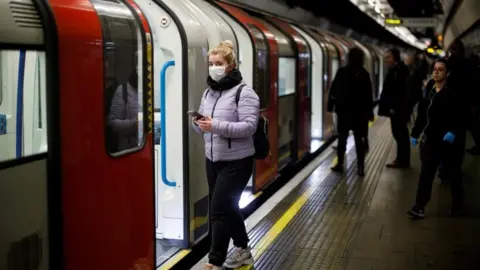
AFPFive and a half weeks since the first confirmed case of Covid-19 in London, the number of cases in the capital was approaching 2,500 on Monday and deaths there made up a third of the UK total.
The BBC asked epidemiologists to look at data provided by Public Health England. They drew these conclusions.

1. Further measures are likely to be needed to halt the epidemic in London
The fact that the number of confirmed cases in the capital has been doubling every two or three days is cause for alarm, the experts say.
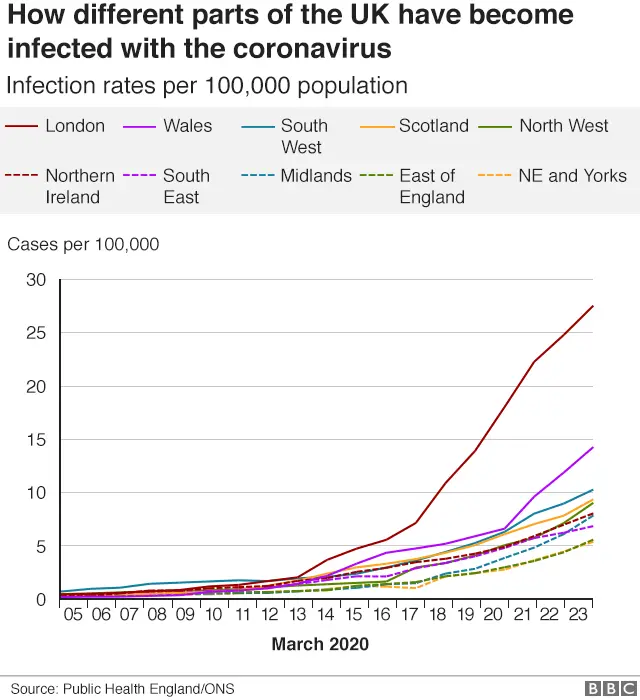

"The line for London going up in that exponential way is an indication that the epidemic is out of control," says Prof Eric Brunner of University College London.
"On this accelerated part of the curve you need to do everything you can to reduce contact between people that is not absolutely essential," says Dr Gary Slutkin, who led the WHO programme on the Aids crisis in the 1990s.
Both Prof Brunner and Dr Slutkin back tough measures to enforce social distancing, of the kind Prime Minister Boris Johnson announced on Monday evening.
But Prof Brunner points out that sanctions are still not being applied to people leaving their homes as strictly as they are in Italy.
"It is still not clear what the reasons are for that," he says. "Perhaps that is so they can avoid a formal state of emergency and so they don't alienate the population. But the behaviour of a population has to change very, very fast to prevent this epidemic becoming a disaster."
 Getty Images
On a more positive note, Dr Slutkin adds: "It is very, very encouraging that if you do it very well, new cases do stop."
The statistics we have are for confirmed cases, the unconfirmed cases are impossible to count. But could these numbers offer a small glimmer of light?
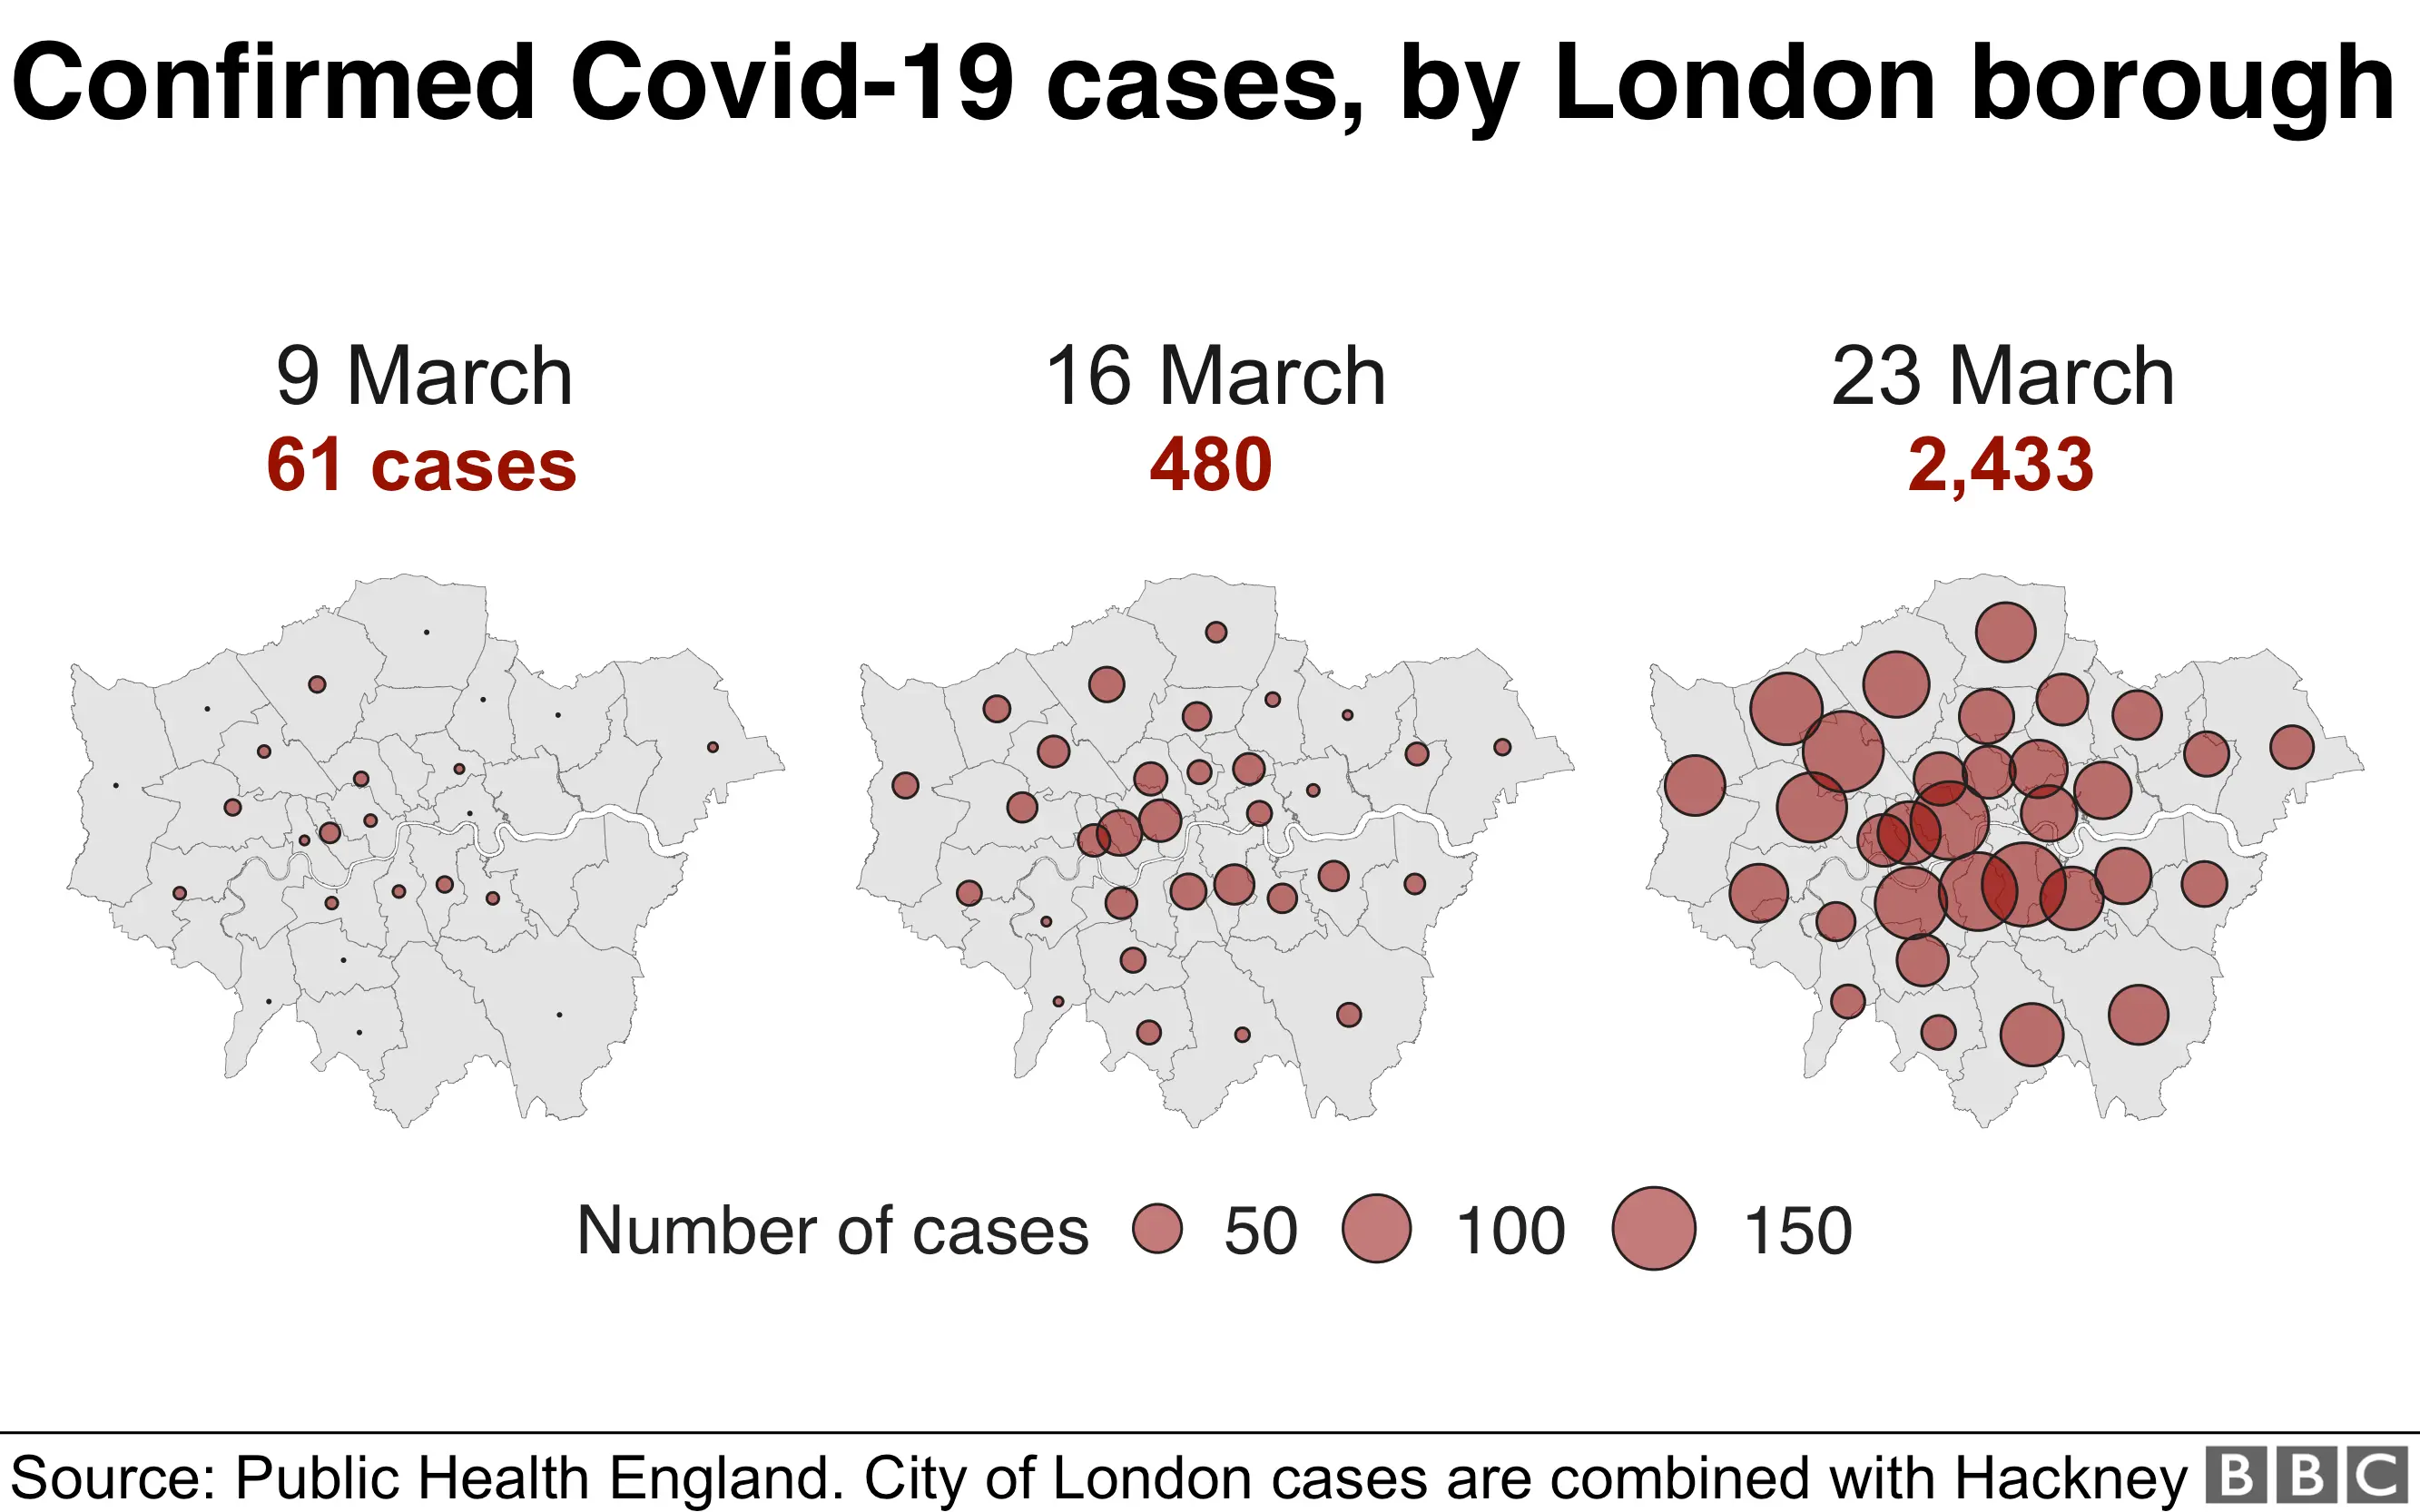
On Monday 16 March, when there were 480 confirmed Covid-19 cases in the capital, this number doubled in two days. It was the same on Tuesday 17 March. But it took four days for the 1,221 cases registered on Thursday 19 March to double, reaching yesterday's total of 2,443.
Dr Michael Head of the University of Southampton says it's too early to say whether this was the result of earlier measures to encourage social distancing, or just "natural variation".
"We will see bumps in the grass on the way up and the way down," he says. "With any big change it can take a while to filter through to the data. It's very much, 'Watch this space.'"
2. The rest of the country is some distance behind London
The reason the curve is steeper in London than elsewhere is that it has "more people, more interactions" says Dr Slutkin. The virus may also have arrived in London earlier, he says.
In densely populated areas, says Dr Head, there are a larger number of "clearly defined contacts" - for example people seated less than 2m apart in restaurants and pubs. All of the 20 most densely populated districts in England are in Greater London.
The fact that more people travel into and out of London from abroad or from other parts of the UK will also have contributed to the epidemic in the city, he says.
 Getty Images
On the other hand, he doesn't think public transport in the capital is likely to have been a major contributing factor "due to the relatively short time periods of being in close proximity to an infected person" while travelling.
Prof Brunner thinks other parts of the country appear to be a week or so behind London.
And Dr Head draws attention to Wales, where the number of cases has begun to increase more steeply than in other parts of the UK.
"The UK is two weeks behind Italy and it's possible that Wales could be a week behind London. It's something to keep an eye on," he says.
3. Don't read too much into differences between boroughs
The first confirmed case in London was recorded on 13 February, when a woman who had recently returned from China went to Lewisham Hospital in the back of an Uber.
Five weeks on and London is a totally different city - with life virtually on hold.
Seven boroughs now have more than 100 confirmed cases - Southwark (154), Brent (143), Lambeth (134), Westminster (134), Harrow (113), Wandsworth (113), and Ealing (106).
 Reuters
Measured by cases per 100,000 inhabitants, the borough with the biggest problem is Kensington and Chelsea with 54.4 cases per 100,000 people followed by Westminster on 52.5 and Southwark on 48.5.
Kensington and Chelsea had the highest number of cases early in the outbreak. Prof Brunner says he has heard the rumour that some of these cases, and others across the capital, resulted from people returning from skiing holidays in northern Italy - but he says this is speculation.
Dr Head argues against reading too much into the differences between London boroughs at this stage in the epidemic. He says the numbers can be expected to fluctuate as the outbreak continues.
4. Hospital beds are not evenly distributed
One study, which has yet to be endorsed by other experts in the field, suggests the NHS's 4,132 critical care beds for adults and 312 for children could be filled by Covid-19 patients in a week.
Another study, also not yet peer-reviewed, points out that the UK's hospital beds are not evenly distributed across the country and that there are potential "hospital deserts" - it mentions the Isle of Wight and Powys in Wales as examples.
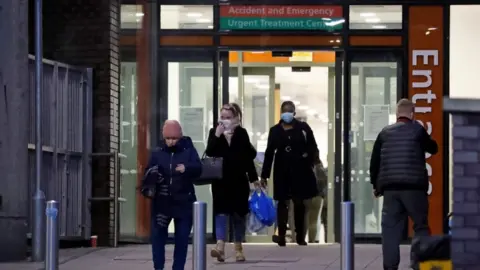
In London it says a pressure point could be the borough of Harrow, where there is a higher than average number of beds per person - but also a higher number of older people, who are likely to be more seriously affected by Covid-19.
 Getty Images
The borough of Newham, by contrast, has far fewer hospital beds per person, but the average age is much lower, so its hospitals are considered less likely to become "overburdened".
The authors say a "critical incident" declared at Northwick Park Hospital in Harrow on Thursday, when it ran out of intensive care beds, was a realisation of their prediction, but they also point out that in urban areas it is easier to move patients to other hospitals.


- A SIMPLE GUIDE: What are the symptoms?
- AVOIDING CONTACT: Should I self-isolate?
- STRESS: How to protect your mental health
- LOOK-UP TOOL: Check cases in your area
- MAPS AND CHARTS: Visual guide to the outbreak


