‘It’s like an oven’: Life in Britain’s hottest neighbourhoods
 BBC News
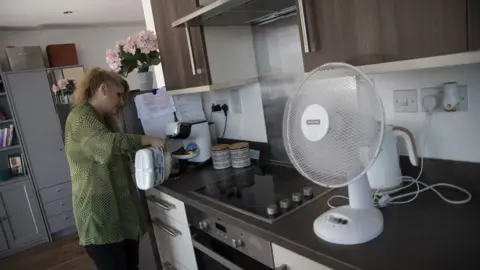
The temperature inside Jorda's flat has hit 30C before midday for the past three days. Though she keeps the blinds closed and a fan whirring in the corner, her home feels stuffy and airless. With the UK recording its warmest day ever on Tuesday, she's struggling to cope.
"The flat gets boiling hot," she says. "It's like an oven."
Jorda is 43 and lives on the top floor of a new-build block in west London with her two young daughters. Her small, concrete balcony, overlooking a neighbouring block and a stretch of busy road, has no shade. Even after the sun sets, traffic noise and exhaust fumes make it difficult to use the space.
"There is still no air, and there is so much dust," she explains. Instead, she shelters in the bathroom, cooler than the rest of the flat.
Jorda's neighbourhood, with a high proportion of people on low incomes or out of work, is one of the most deprived areas of the country. And people living in places like these across Britain are most at risk from severe heat.
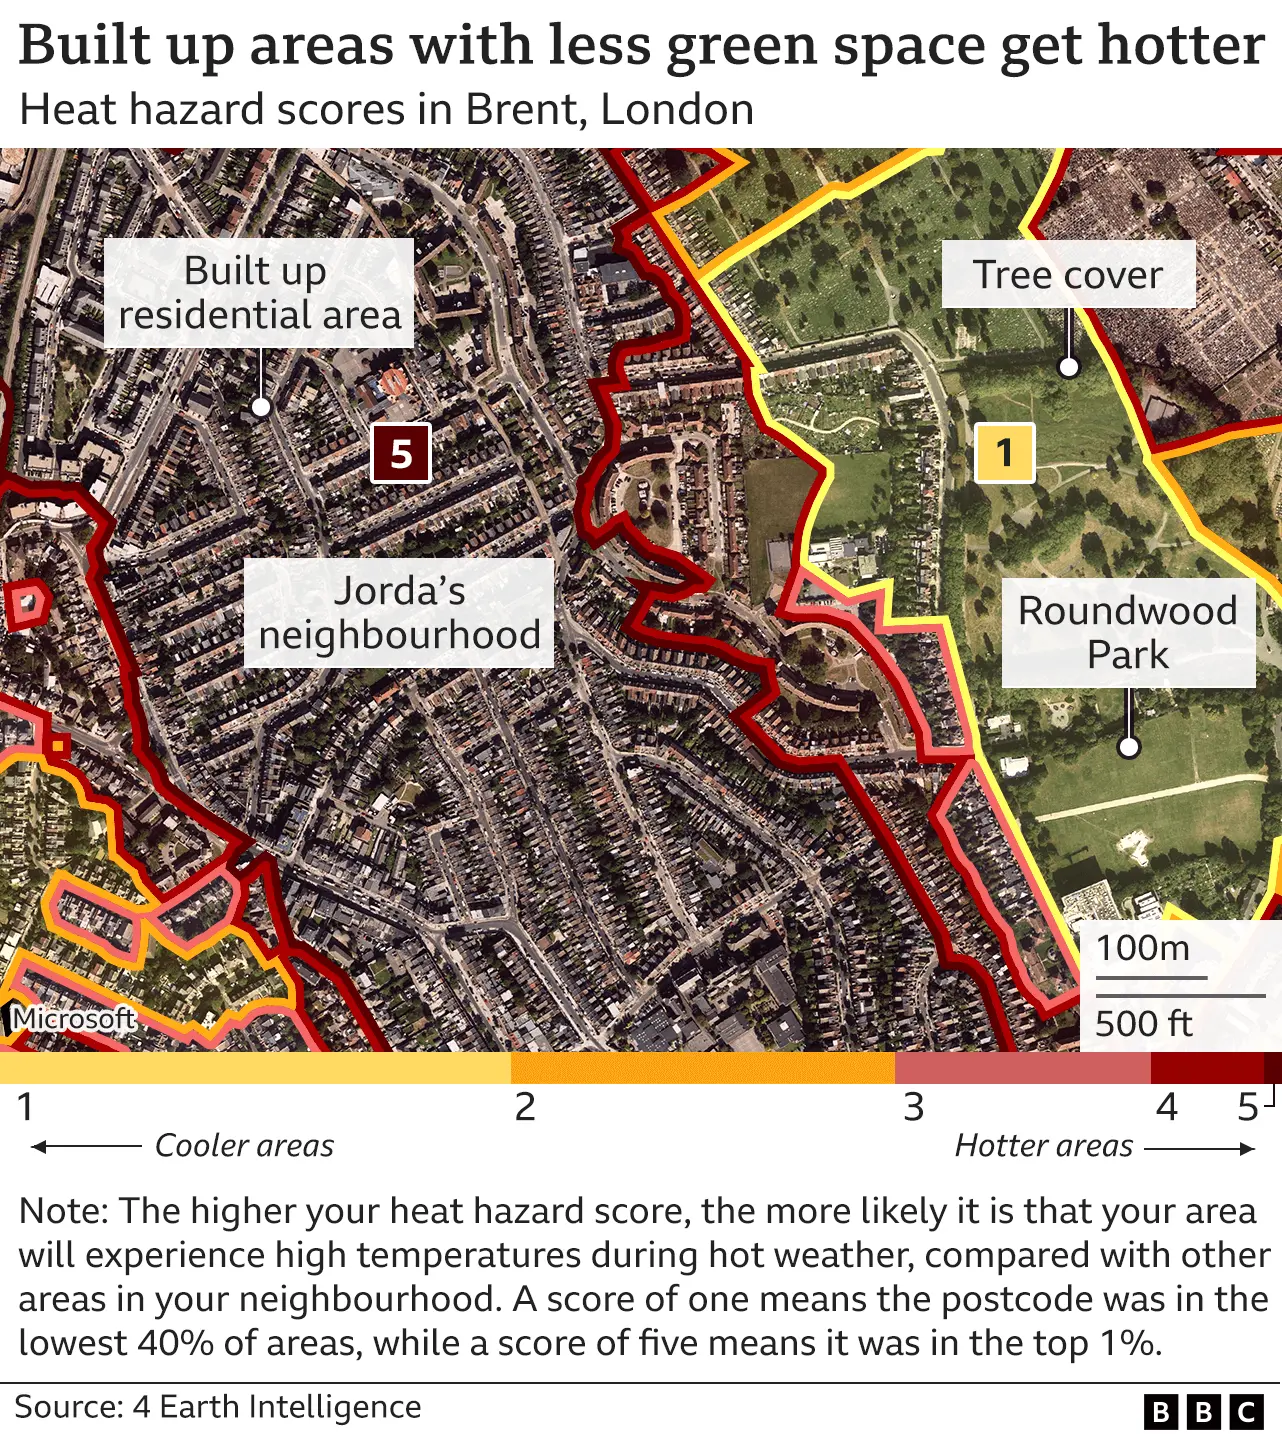
Analysis by the BBC of satellite data from 4 Earth Intelligence and figures on relative poverty in England, Scotland and Wales, suggests people in deprived areas are more than twice as likely to live in places which are significantly hotter than neighbouring places.
The difference is down to a phenomenon known as the urban heat island effect, where buildings and roads absorb and retain heat, and become significantly hotter than surrounding areas with shade or green space.

For Jorda, the heat is very challenging. She is frequently hospitalised with asthma attacks that leave her gasping for breath, and her symptoms are made worse by hot weather. Her condition has meant she had to give up the hair-styling job she loved and has limited her ability to leave the house.
"At any moment I could get a severe asthma attack." In the summer, she can't relax inside or outside her flat. "I live in fear," she says. "That's not what you call a life."

Her neighbourhood is particularly susceptible to heat. According to 4 Earth Intelligence's heat hazard scale that goes from one to five, Jorda's postcode area is a five. On one day last July, the area where she lives was a full 5C hotter than in a nearby park.
BBC analysis estimates that six million people live in places at risk of higher heat across Britain during the summer months. And it's likely to get worse. Climate change is causing temperatures to rise across the UK, which is experiencing longer and more frequent heatwaves.

Extreme heat is dangerous to everyone, causing heat exhaustion and heat stroke, and increasing the risk of a heart attack. But some people are affected more than others.
"Anyone with severe illness or underlying conditions, older people, babies and the disabled can get overheated quite quickly," says Anthony Costello, professor of global health and sustainable development at University College London.
"If you're in a top floor flat, if you're homeless, if you work outside and you have to do a lot of physical exertion, you are very vulnerable," he says.
And people who live in deprived areas tend to have poorer health to begin with, and higher rates of chronic conditions associated with greater vulnerability to heat.

For Andrea Moore, 150 miles away in Cardiff, hotter summers are an increasing concern. The former catering worker has COPD, a chronic lung condition that causes difficulty breathing, chest pain and chest infections. Like Jorda, Andrea's condition worsens in the heat and during a heatwave, she just sits indoors.
"There's a lot more traffic around and heat radiates off the buildings," Andrea says. "I close the curtains, and if it gets really bad, on comes the fan with a bottle of frozen water in front of it."
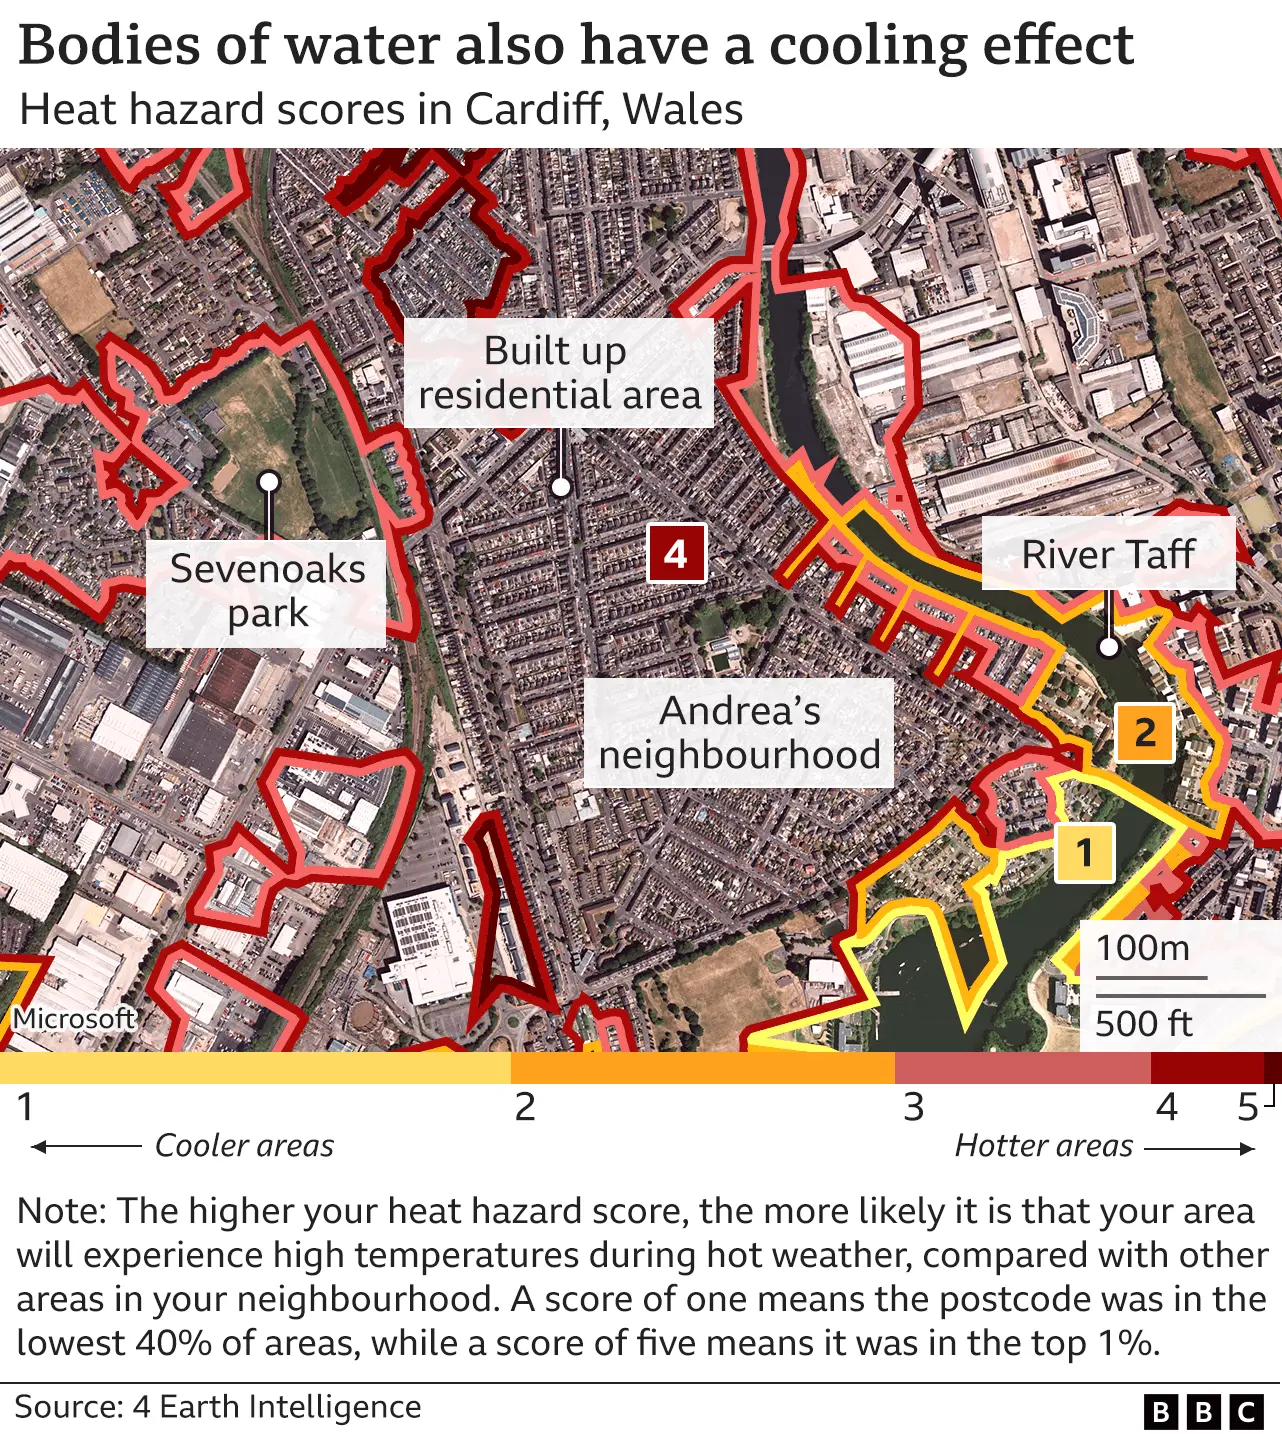
More than one in six neighbourhoods in Cardiff are classified as heat/high deprivation hotspots according to BBC analysis, and Andrea's first-floor flat falls within one of them.
Her neighbourhood has a high number of people with poor health and unsuitable housing, and one day last summer, it was 5C hotter than the nearby Sevenoaks Park.

While staying indoors helps, our homes are not built for more frequent heatwaves, says Rohinton Emmanuel, professor of sustainable development at Glasgow Caledonian University.
Changing how cities and towns are built could help us to cope better, he says. That means having buildings at different heights to create shade and create a breeze, for example, and planting more trees. Green roofs and green walls can reduce the amount of heat absorbed by buildings, as can using less glass and retrofitting buildings with lighter coloured and more reflective materials.
"Cities take considerable time to change. We are already late," he says. "We need to take action now."
As many as 4.6 million homes overheat in England, suggests a recent survey from Loughborough University. But until this summer, no rules governed overheating in new buildings. The UK's Climate Change Committee, which tracks the government's progress on its climate commitments, predicts that heat-related deaths could triple over the coming decades without government action.
The summer of 2020 saw the most deaths related to heatwaves since records began in 2004, with more than 2,200 deaths in over-65s when temperatures hit 33C.
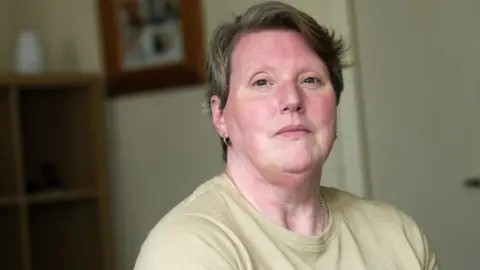
Scotland is not known for its hot weather, but when the sun blasts through the windows of Liz Andrews' flat five miles from Glasgow centre, it can quickly become intolerable.
"You can literally feel the heat as you walk through the front door," she explains.
 BBC News
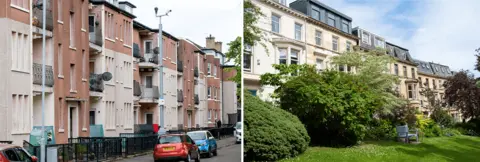
 Liz lives on the ground floor of a 1930s tenement block in Yoker, in a neighbourhood where lots of people live in poor quality housing. Over the years, front lawns have been covered over with gravel, and she says it makes her home sweat in the summer.
As the cost of living rises, simple solutions like turning on the fan are more complicated. Liz is on a pre-paid meter and has seen her energy prices soar to about £40-£50 a week. Shutting the blinds brings the added expense of switching on the lights. And travelling to the nearest big park means spending money on bus fares.
"We really feel the pinch with the heat. It's all very well to say have an ice lolly but sometimes you can't afford ice lollies," Liz says.
Glasgow City Council says protecting residents against overheating is a key concern. It has recently introduced a climate plan which notes that the city's housing is underprepared for hotter temperatures and acknowledges the need to address equality of access to green spaces.
It's a problem Liz is keenly aware of. Her son Simon, who has a learning disability, is supported to tend a community allotment in Drumchapel - it's cooler there, but it is a 25-minute bus-ride away from their home. Liz wants more open spaces "on her doorstep".
"All the wee spaces, they're just building houses on them," she says.
In Harlesden, Jorda faces similar issues. For the moment, she doesn't want to move away from the hospital that has been treating her asthma when the next attack could be just around the corner.
But she says she feels unsafe in the small green space near her home with little grass, and thinks a more accessible park or community garden might help.
"I don't mind living in an area like this if I could breathe. Just to be in a bit of fresh air… it would be better than this."

About the data
Where is the data from?
The potential heat hazard score for each postcode area and another small geographical area - known as a Lower Layer Super Output Area (LSOA) - was calculated by 4 Earth Intelligence, who measured the average land surface temperature over a sample of days in the past three summers across Great Britain.
Deprivation data was taken from the latest English, Scottish and Welsh Indices of multiple deprivation (IMD). Each IMD is the nation's official measure of relative deprivation, or poverty, and is weighted heavily towards income, employment, education, and health.
What does each heat hazard score mean?
Each score, ranging from one to five, is an indicator of how likely it is that your area will experience high temperatures during hot weather, when compared with other areas in your surrounding neighbourhood.
How was the score calculated?
A statistical method published by academics was used to standardise land surface temperatures for each postcode area, which involved combining satellite images for different dates over the past three years.
The temperature data was then adjusted to consider the different average temperatures of each region, to highlight hotter areas across the country, despite varying climates and temperatures.
Each heat hazard score represents different sized groups, as described below.
- 1 = 40th percentile and lower, if you lined up all the postcodes by heat hazard score, your postcode is in the coolest 40%.
- 2 = 40th - 70th percentile, your postcode is in the mid-range. 40% of postcodes have a lower heat hazard than yours but 30% have a higher one.
- 3 = 70th - 90th percentile, your postcode is towards the upper end of the scale. 70% of postcodes have a lower heat hazard than than yours but 10% have a higher one.
- 4 = 90th - 99th percentile, nine out of 10 postcodes have a lower heat hazard than yours and only 1% have a higher one.
- 5 = 99th percentile, your postcode area has among the highest heat hazard scores.
How did you combine heat and deprivation data?
The heat hazard score was calculated for LSOAs, which also have a population estimate and a deprivation score in its nation's IMD.
IMD scores are split into five even groups by nation, or quintiles, and each area is given a score from one to five based on its level of deprivation. One being the most deprived, or poorest, areas and five being the least.
The BBC then combined the heat data by nation with the population estimates to calculate the number of individuals estimated to live in each heat hazard score.
Taking the areas with a heat hazard score of four or five, the top 10% of heat hazard scores, and also areas with deprivation scores of one and two, the 40% most deprived areas, a calculation was then made to reveal the percentage of people living in higher hazard areas which were also more deprived.
Why does my postcode show a square block?
A single building can contain more than one postcode, such as a block of flats, this is known as a vertical street.
On the heat hazard map, postcodes that are part of vertical streets are represented by a square shape.
Vertical street postcodes which sit away from the main postcode area, or inside other postcode areas have inherited the heat hazard score from the main postcode they originally belong to.
I live in Didcot or Northampton, why is there no data for my area?
Postcodes in Didcot and Northampton do not have a heat hazard score. This is because of limitations in the way the satellite data was collected which meant scores for neighbourhoods in these areas were not comparable to one another.
Produced by Rob England, Harriet Bradshaw, Libby Rogers, Jana Tauschinski, Deirdre Finnerty, Wesley Stephenson, Yazmina Garcia and Steffan Messenger. Development by Alexander Ivanov, Marcos Gurgel Shilpa Saraf and Becky Rush. Data provided by 4 Earth Intelligence.
