Climate change: 'Exceptionally hot' 2020 concludes warmest decade
 BBC
BBCGlobal meteorological agencies agree that 2020 was a scorching year but they are divided on just where it ranks in the temperature records.
For Nasa, last year is in a statistical dead heat with 2016 as the warmest year.
Others, including the UK Met Office, believe it is second in the rankings dating back to the 19th Century.
But all the agencies reporting on Thursday agree that last 12 months are part of the warmest decade on record.
Just last week, a report from the EU's Copernicus Climate Change Service indicated that 2020 was tied with 2016 as the warmest year.
Thursday's reports, from five key agencies around the world, show some dissent from this view, but all agree 2020 is in the top three.
 Wales News Service
Nasa says 2020 is tied with 2016, while the US National Oceanic and Atmospheric Administration (Noaa) and the UK Met Office have it second.
The Japan Meteorological Agency (JMA) has 2020 as the third warmest year.
The differences between the datasets are all within the margin of error, says the World Meteorological Organization (WMO) which has consolidated the information from the agencies.

Some key facts about 2020 temperatures
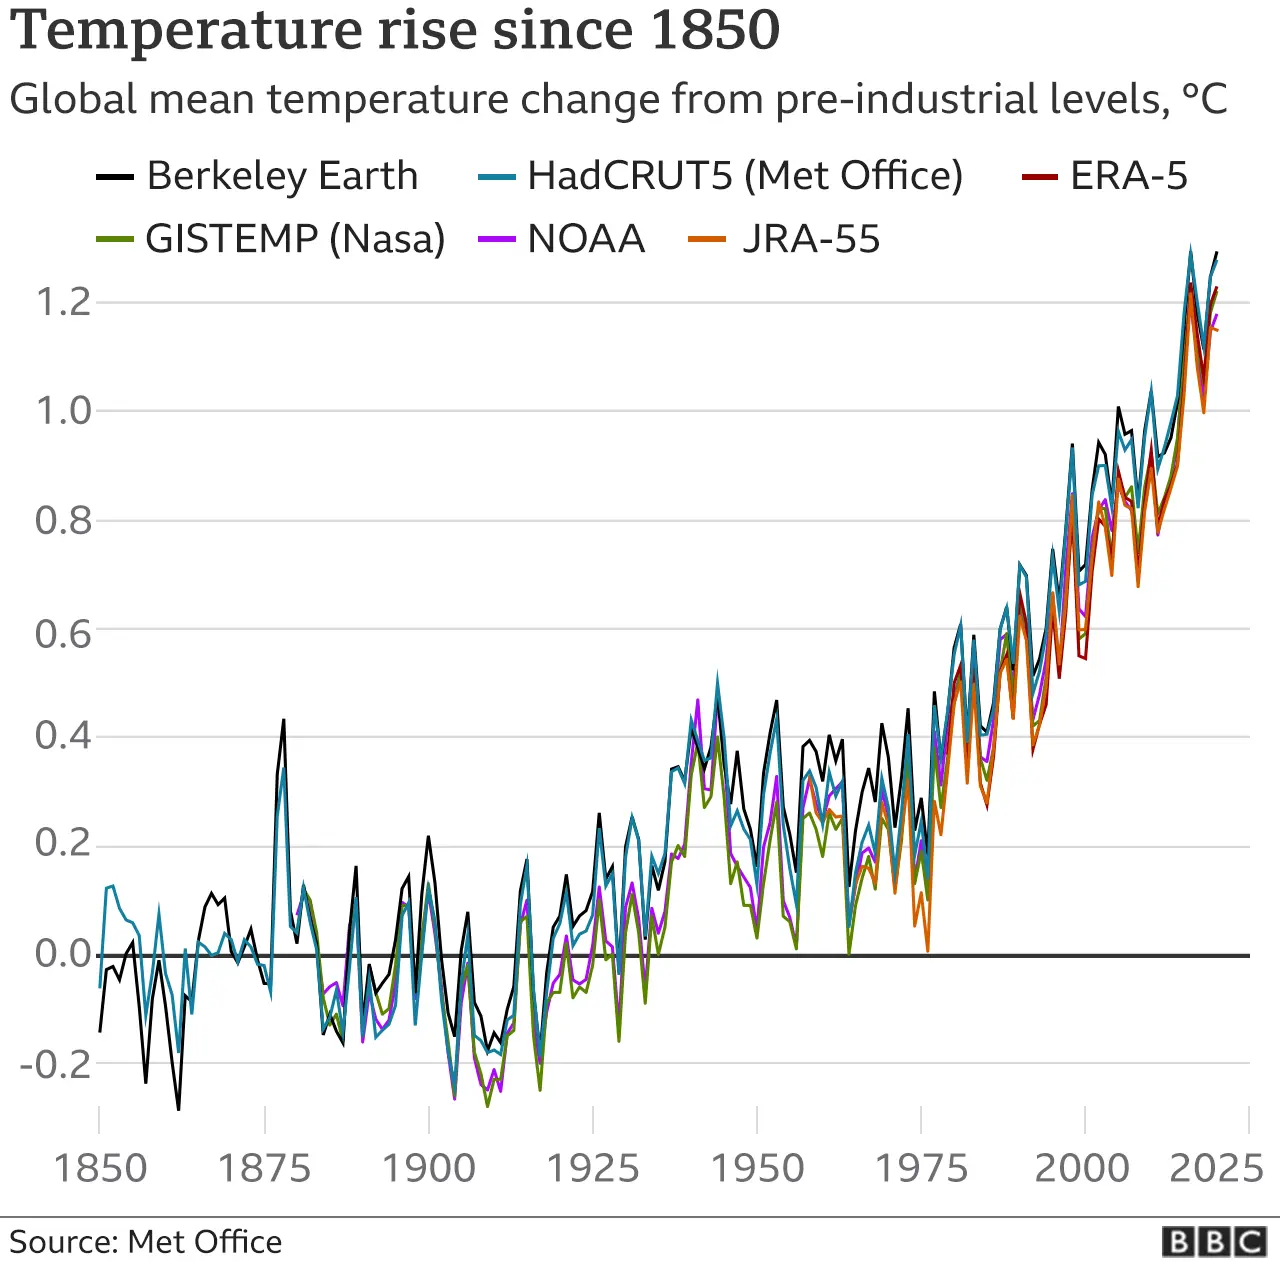
- The average global temperature across the year was around 14.9C, putting it around 1.2C above the average between 1850-1900
- The 10 years from 2011-2020 were the warmest decade on record
- The warmest six years on record have all occurred since 2015
- The differences between the top three, 2020, 2019 and 2016 are "indistinguishably small".
Source: WMO

Taken together they show the global temperature is now around 1.2C above the 1850-1900 average, sometimes referred to as the "pre-industrial figure".
Ongoing emissions of carbon dioxide (CO2) from human activities are the key element in driving up temperatures, say researchers.
While greenhouse gases declined by around 7% globally last year in response to the coronavirus shutdowns, this wasn't enough to affect temperatures.
"Because we haven't stopped doing that and, in fact, we continue to do that even with the pandemic, we're still putting our foot on the accelerator of climate change," Dr Gavin Schmidt, director of the Nasa Goddard Institute for Space Studies, in New York, told BBC News.
"We anticipate that the planet will continue to warm at the rate that it has and maybe even accelerate, unless we get those emissions down, and that's a big task."

Why are there different temperature analyses?
By Jonathan Amos, Science Correspondent

Every January we get a report on the surface temperature of Earth in the previous year. Or rather, we get several. Different leading agencies around the globe do their own particular analysis. Ignore the funny labels like HadCRUT5 by the UK Met Office or JRA-55 used by the Japan Meteorological Agency - what lies behind these names are some sophisticated statistical approaches.
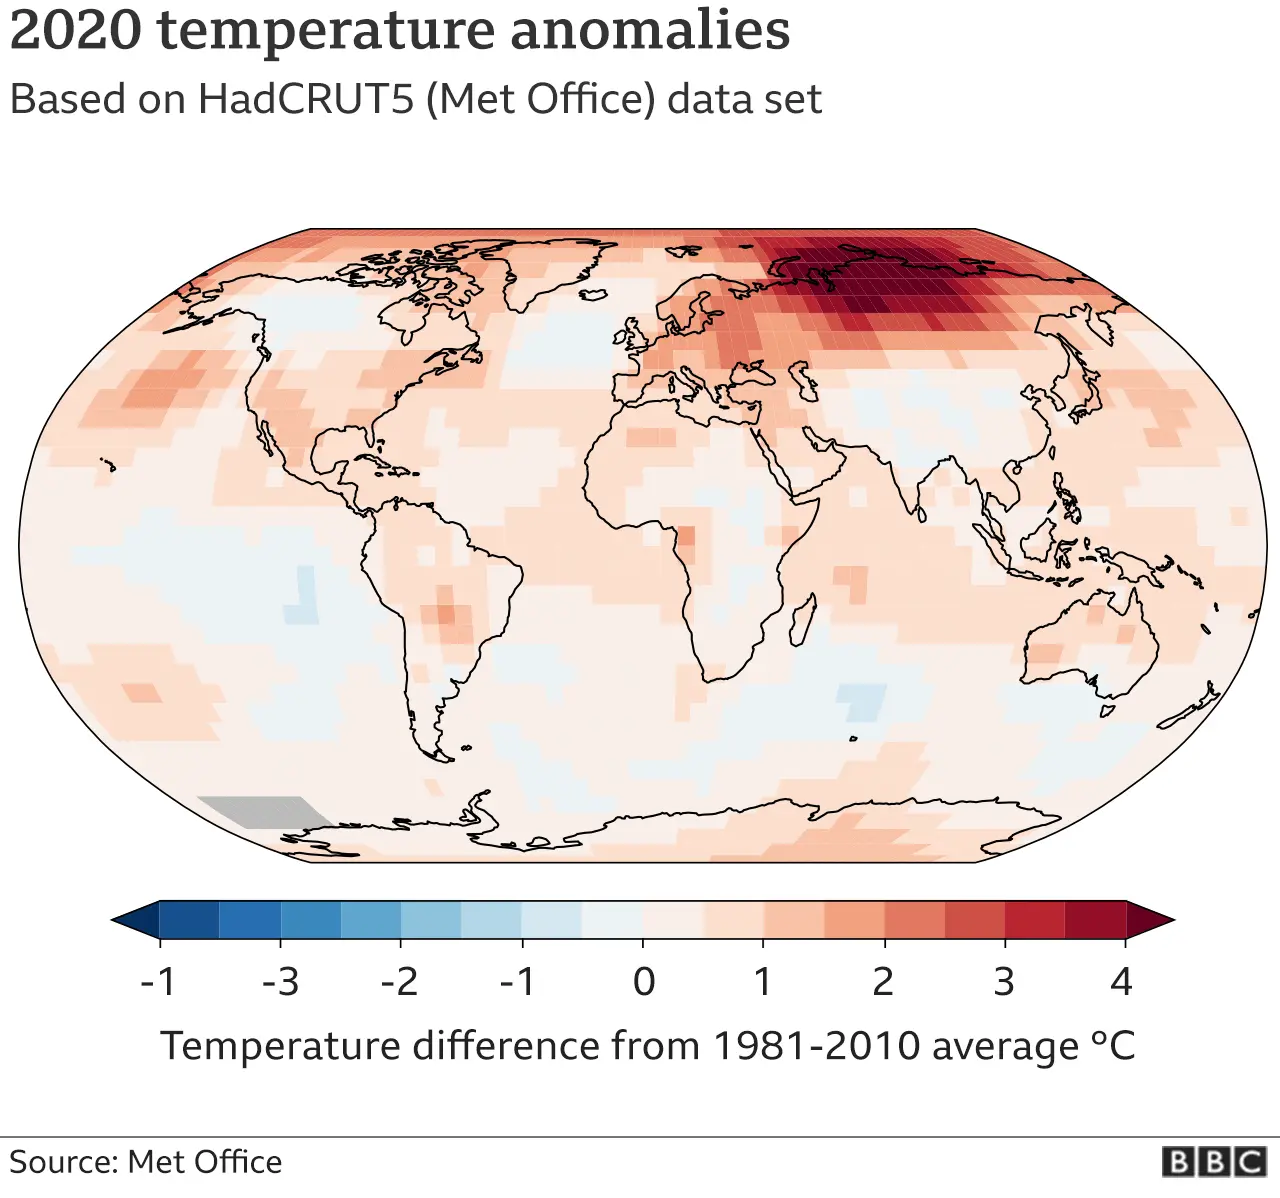
All the different temperature curves you see above are built on broadly the same raw data. This comes from millions of temperature measurements gathered by instruments on land and at sea (some ship-borne, some floating). What sets the individual analyses apart is the different ways the agencies go about handling quirks and biases in the data. For example, how do you incorporate the Arctic where we have relatively few measurements but where we know temperatures are rising faster than most other places?
The different agencies have their own ways to extrapolate from nearby instrument stations to gauge what's going on in this region. It's best not to get hung up on the small differences between the curves. Look instead at the trend. On this they all absolutely agree 100%. Planet Earth is warming.

One of the key concerns in the data from 2020 is the way that the warming driven by humans is over-compensating for natural events that help reduce temperatures.
"The exceptional heat of 2020 is despite a La Niña event, which has a temporary cooling effect," said WMO Secretary-General, Prof Petteri Taalas.
"It is remarkable that temperatures in 2020 were virtually on a par with 2016, when we saw one of the strongest El Niño warming events on record. This is a clear indication that the global signal from human-induced climate change is now as powerful as the force of nature."
The fact that 2020 saw global temperatures rising 1.2C above the pre-industrial figure is a growing concern.
Under the Paris Agreement, governments have promised to make their best efforts to keep global temperature rise below 1.5C this century, as scientists have shown it makes a massive difference to keeping our planet habitable.
In fact, if you just look at the temperatures on land, 2020 breached this limit.
According to Noaa, the globally-averaged land surface temperature for 2020 was 1.59C above the 20th Century average. This is the highest among all years in Noaa's 141-year record and surpasses the previous record set in 2016 by 0.05C.
 Reuters
"2020 has proved to be another notable year in the global climate record," observed Dr Colin Morice, senior scientist in the Met Office's climate monitoring team.
"With all datasets showing a continued rise in global average temperature, the latest figures take the world one step closer to the limits stipulated by the Paris Agreement."
Another factor that helped drive up temperatures in 2020 was air pollution, or the lack of it.
Global lockdowns meant fewer cars on the roads and airplanes in the sky.
As the dirty air disappeared this allowed more sunlight to hit the Earth's surface, boosting temperatures.
"The cars that we drive produce a lot of what's called NOx, nitrogen oxides. And those went down pretty much everywhere, where we had restrictions," said Dr Schmidt.
"And what that has done is it has removed a little bit of that reflective air pollution. Our calculations and (those of) others suggest that that may have warmed the climate just a little bit over the last year."
Follow Matt on Twitter.
