House prices: Have they actually gone up in your neighbourhood?
House prices in more than half of neighbourhoods in England and Wales are still lower in real terms than a decade ago, BBC analysis has revealed.
In 58% of wards, residential properties are selling for less now, after accounting for inflation, than they were in 2007.
If you can't see the postcode search, click this link to open the same story outside of Google AMP or the Twitter app
The findings, drawn from official data, expose a stark regional divide in price movement since the financial crisis.
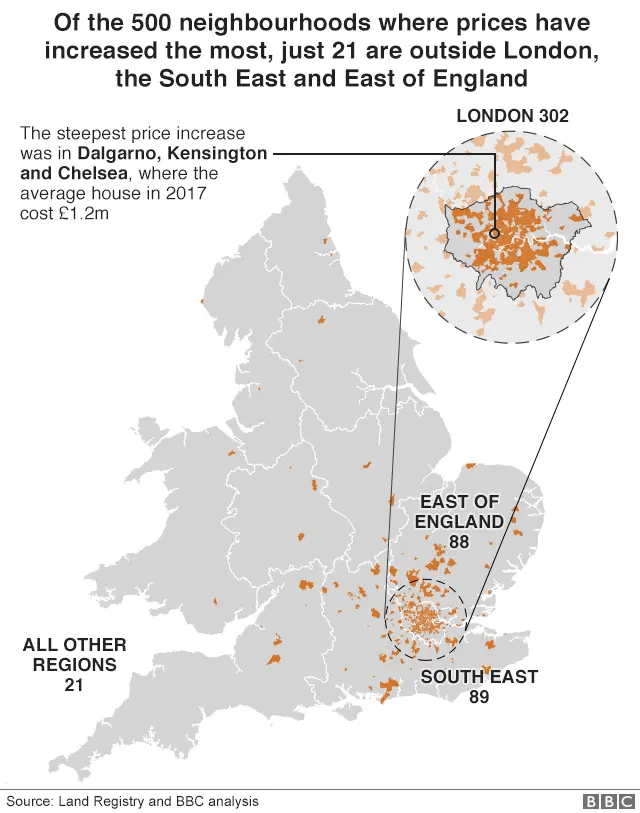
Rising house prices have been confined to the South East and East of England.
Average house prices in Wales, Yorkshire and the Humber, the North East and the North West have declined by more than 10% since 2007, when values are adjusted for inflation.
Meanwhile the latest official figures indicated that house prices across the UK rose by 5% in the year to August, taking the average price of a property to £226,000.
The Office for National Statistics said the smallest increase was in London, where prices rose 2.6%.
Adjusting for inflation when comparing 2007 house prices to those in 2017 allows for a more realistic comparison of their value given changes in the cost of living over the last 10 years.
Map built with Carto
Housing market analyst Neal Hudson said the income squeeze in many parts of the country had constrained house price growth.
"Some people are trapped in their current homes as they have seen no increase in their income and cannot afford to borrow more," he said.
"Potential first-time buyers in the private rented sector do not have a sufficient or stable income to buy their first home. The idea of committing to a 25 to 30-year mortgage when they are not sure what they are going to earn in the next year is difficult."

The BBC data team and the Open Data Institute (ODI) Leeds analysed more than eight million residential property transactions in England and Wales from the Land Registry database for the period from 2007 to July this year. These exclude mortgaged buy-to-let properties.
The price of an average home in England and Wales has remained flat since 2007, after taking inflation into account.
Although most regions have seen house prices go up, this has not been as fast as the rate at which prices in the rest of the economy have risen.

In some areas, a decline in the average house price could potentially be attributed to single properties being split up into multiple ones, as the analysis is unable to take into account the size of the property sold. In Hyde Park and Woodhouse ward in Leeds, the average price so far this year was 57% down from 2007, largely due to the sale of almost 50 student flats.
At one end of the scale, some parts of London have seen massive increases in house prices compared to a decade ago.
The average house price in some areas of Tower Hamlets and Hackney has more than doubled, even when adjusting for inflation.
In the Notting Dale ward of Kensington and Chelsea, which contains Grenfell Tower, average prices had risen from £340,000 in 2007 to £600,000 in 2016. In three of the wards bordering Notting Dale property prices average more than £1m.
Prices have also risen significantly in some parts of the East of England and the South East. In Iver village and Richings Park ward in South Buckinghamshire, the average price so far this year is £700,000, up from £275,000 in 2007.

The least expensive ward in the country is North Ormesby in Middlesbrough.
In 2017, the average house price there was £36,000. At £2.9m, an average home in the most expensive ward - Knightsbridge and Belgravia - costs the same as 80 homes in North Ormesby.
Horden, in County Durham, is another ward that has seen a major decline in house prices over the last decade. The average price for a residential property in the area has gone down from £74,000 ten years ago to just below £40,000 so far in 2017.
Lee Percival bought his two-bedroom home in Horden in 2008 for £113,000. It is now worth around £85,000.
"I feel trapped. I regret buying it, my wife loves it but I feel like we've made a loss. I think I'd just have to cut my losses or rent it out. I know I could never sell it at the moment," he told the BBC.
Areas in Wales have also seen a significant drop in house prices, with nine in 10 wards in the country now selling for less in real terms than they were before the financial crisis.

The number of homes being bought and sold in England and Wales has also not recovered to pre-crisis levels.
Some property experts think transaction figures may provide a more accurate indication of the health of the market than house prices.
In 2007, almost 1.3 million residential properties were sold at full-market value in England and Wales.
The following year that figure almost halved and despite having risen significantly in 2014, sales still totalled just over 900,000, last year, according to Land Registry data.
Potential buyers' ability to purchase a property is not based solely on the cost of the house.
Lenders have been told to impose stricter criteria when offering mortgages since the financial crisis. That has led to more stringent analysis of borrowers' ability to repay and higher initial deposits than 10 years ago, in all parts of the country.
Low wage growth has also affected confidence of people willing to buy for the first time or move to a more expensive property.

Produced by Daniel Dunford, Nassos Stylianou, Ransome Mpini, Tom Forth (ODI Leeds), John Walton, Kevin Peachey and Ruth Green. Design by Sumi Senthinathan. Development by Joe Reed and Gabriel Lorin.
How is the average for your ward calculated?
The BBC data team and the Open Data Institute (ODI) Leeds analysed all residential transactions sold at full market value in England and Wales from the Land Registry database for the period from January 2007 to July 2017. Therefore repossessions, buy-to-lets - where they can be identified by a mortgage - and purchases by companies are not included in the analysis.
HM Land Registry does not cover addresses in Scotland or Northern Ireland. Registers of Scotland data, available here, is not free to download and the NIdirect land Registry for Northern Ireland do not make comparable data available.
All of the England and Wales transactions were then mapped to government wards, small electoral districts, using ward boundaries from the Office of National Statistics as of December 2016.
The median was used to calculate the average house price for every ward in each of the years from 2007 to 2017. Where there were fewer than 10 transactions per ward in a given year, the median is not provided given the small sample size.
To calculate the percentage change from 2007 to 2017 in real terms, the 2007 price paid figures were first adjusted for inflation using the Consumer Prices Index (CPI) figures for July 2017 and the month in 2007 that the house was sold.
The percentage change between the median price for each ward from 2007 (adjusted for inflation) to 2017 was then calculated.
In some areas, a decline in the average house price could potentially be attributed to single properties being split up into multiple ones, as the analysis does not take into account the size of the property sold.
