A look at how Australia voted - in charts
Australian Prime Minister Anthony Albanese has been re-elected as the country's leader, becoming the first in decades to secure a second term.
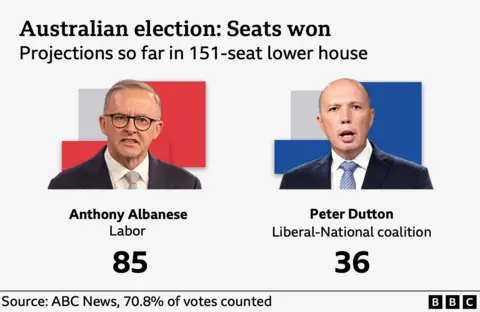
He defeated opposition leader Peter Dutton of the centre-right Liberal-National coalition. Dutton also lost his seat in Dickson, Queensland - one he had held for 24 years.
It is a remarkable turnaround for Albanese, 62, whose popularity was at record lows at the start of the year as Australians grappled with a cost of living crisis and challenges in healthcare and housing.
US President Donald Trump's global tariff policy, which did not spare Australia, was also on voters' minds.

 Getty Images
Here's a look at how that played out in charts, based on an unofficial count by Australian broadcaster ABC:
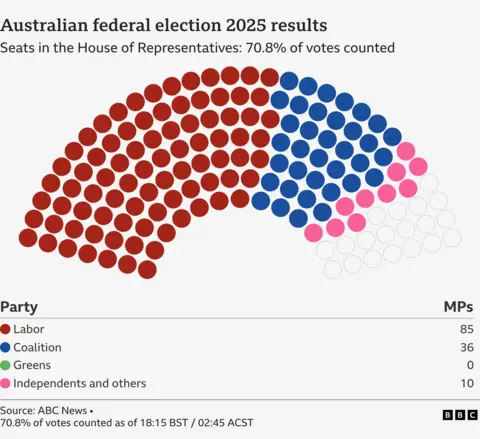
Albanese needed at least 76 seats in the House of Representatives to form a government.
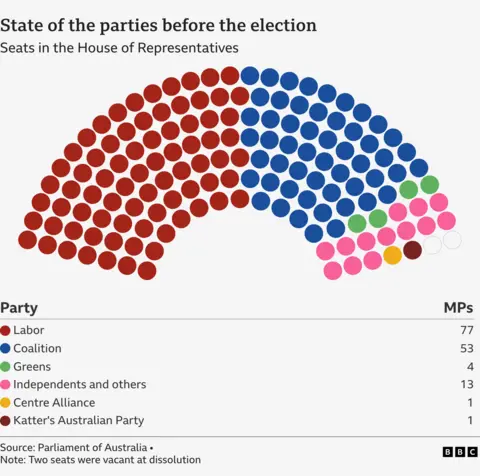
Before the dissolution of parliament, Labor had a razor-thin majority of 77 seats.
With some 70.8% of the seats already counted, the ABC puts Labor on track to finish with 85 seats - far above the 76 seats needed, giving it a comfortable majority.
The Coalition is expected to gain 36 seats and the Independents stand at 10.
Here's a reminder of what the seats in the House of Representatives looked like before tonight's results.
Current projections mean Labor has so far claimed 34.7% of first-preference votes, with the Coalition trailing behind at 31.7%.
The Greens stand at 12.2% of first-preference votes.
As compared to the 2022 election, its clear Labor has increased its share of the national vote, with an increase of 2.1% so far - though that number could increase as counting goes on.
Official vote counting won't conclude for days but its clear that the Labor government is set to dramatically increase its majority - with swings towards them in almost every area.