How Canada voted - in charts

 BBC
BBCMark Carney's Liberal Party has won enough seats in the House of Commons to form a government in Canada.
However, they have fallen short of the majority they wanted.
Carney remains prime minister, having only assumed the role in early March following Justin Trudeau's resignation.
His main rival, Conservative leader Pierre Poilievre, has lost his own seat as has Jagmeet Singh, leader of the New Democratic Party (NDP).
Carney's Liberals have 169 seats but would need 172 for a majority.
The Conservatives remain in opposition as the second-largest party and are on 144 seats.
The Bloc Québécois is on 22 seats and only runs candidates in the province of Quebec. The NDP has been reduced to seven seats and the Green Party to one.
While the election took place on 28 April, it took several weeks for some results to be confirmed.
Elections in four areas were very close and went to judicial recounts - a formal means of verifying the counts, each presided over by a judge.
They found that in Terrebonne, Quebec, the Liberals won by one vote and in Milton East-Halton Hills South, Ontario, the party won by 21 votes.
And in Windsor-Tecumseh-Lakeshore in Ontario, the Conservatives were confirmed by a judge to have won by four votes.
Finally, on 23 May, the Conservatives were revealed to have won Terra Nova-The Peninsulas in Newfoundland and Labrador by 12 votes following a judicial recount. Preliminary results had seen the party lose the seat to the Liberals by the same margin.
Both the Liberals and the Conservatives have seen a significant rise in their share of the national vote compared with four years ago.
Increased support for Canada's two largest parties has come at the expense of smaller parties, particularly the NDP whose share of the popular vote is down by almost 12 percentage points.
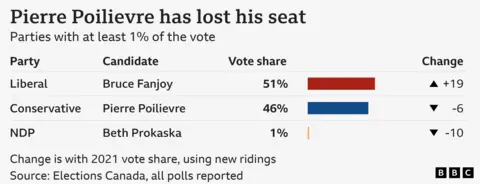
The rise in support for the Conservatives was not enough to save Poilievre, who lost his own seat in Carleton, Ontario.
The 45-year-old had promised a return to "common sense politics".
Opinion polls at the start of the year had the Conservatives over 20 percentage points ahead of the Liberals. But after the resignation of former Liberal Prime Minister Justin Trudeau and the arrival of new PM Mark Carney, as well as the tariffs announced by US President Donald Trump, that lead evaporated.
In his own seat, Poilievre had 90 opponents, including dozens of independent candidates linked to a group calling for electoral reform.
NDP leader Singh also lost his own seat in the House of Commons, coming third behind the Liberal and Conservative candidates.
Canada has a "first-past-the-post" electoral system.
The candidate who gets the most votes in each electoral district, or riding, wins that seat and becomes a Member of Parliament (MP).
The Liberals and the Conservatives have dominated the popular vote, with both parties receiving more than 40% each of ballots counted across Canada.
Between them, they have over 90% of seats.
The NDP has received just over 6% of the total vote, but this translates to just 2% of seats in the House of Commons.
The Bloc Québécois has just over 6% of the vote and a similar share of seats.
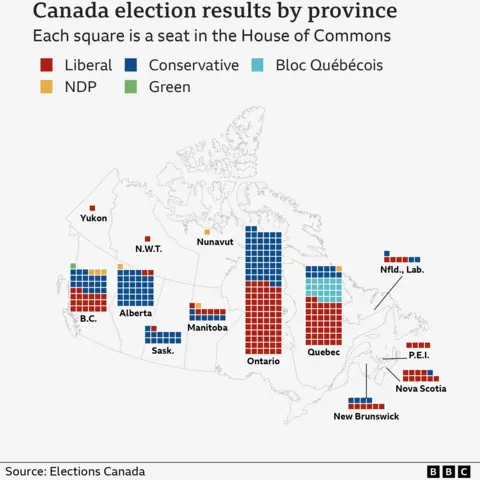
The Liberals have the most seats in the key provinces of Ontario and Quebec, which account for 200 of Canada's 343 electoral districts.
The Conservatives took all but three of the 37 seats in Alberta, while it was a close race between the two main parties in British Columbia, where the Conservatives have 19 seats and the Liberals 20.
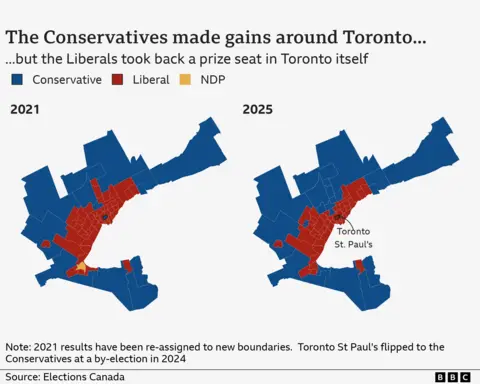
One of the most closely-watched areas was around Toronto. The "905" are places that all share the same telephone code.
While the Liberals have won in most of Toronto, including a seat they lost in a by-election last year, the Conservatives were able to flip some of the ridings in the surrounding region.
The NDP have lost a seat, Hamilton Centre, that they'd held for over 20 years.
Preliminary results saw Milton East-Halton Hills South flip from the Liberals to the Conservatives by 298 votes. However, following vote validation and a judicial recount, it was found to have stayed Liberal by 21 votes.
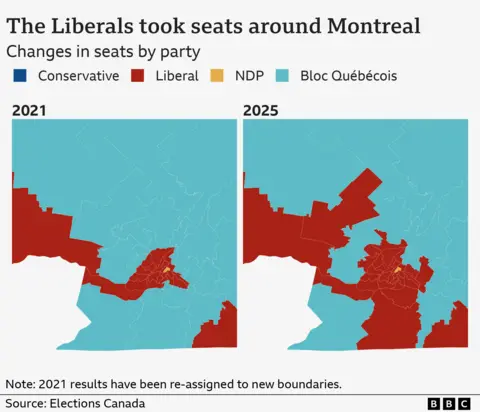
After Ontario, Quebec is the second most populated province of Canada and has a big impact on the results of federal elections.
The Bloc Québécois, which focuses on Quebec interests and only runs candidates in the province, was defending 35 seats, a number which changed after boundaries were reviewed. It has lost 13 of them.
The Liberals won back LaSalle-Émard-Verdun, which the Bloc took in a by-election last year.
The NDP held on to their seat in Rosemont-La Petite-Patrie in Montreal.
Preliminary results saw the Montreal suburb of Terrebonne flip to the Liberals by just 35 votes but, after Elections Canada's vote validation, Bloc Québécois held it by 44 votes.
That result then went to a judicial recount, which found the Liberals had in fact won by one vote.
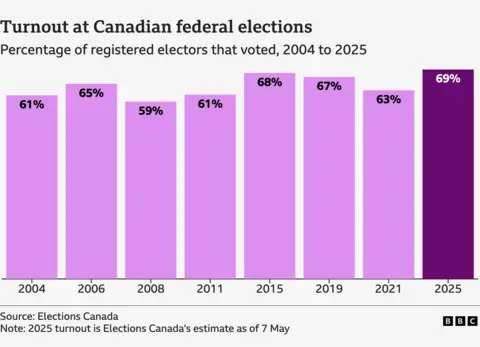
Turnout has surpassed the levels seen in 2015 and 2019, with 69% of registered electors having voted. This is according to Elections Canada's updated estimates on 7 May.
More than 7 million Canadians cast their ballots in advance, setting a new record for early voter turnout, Elections Canada said.