Coronavirus restrictions: Why is so much of the North and Midlands in tier 3?
 Getty Images
From December 2, three-quarters of people living in the North of England and the Midlands will be facing the toughest restrictions.
But in the South of England, just 10% of people will face the tier three curbs.
Why is this?
What does the data show?
The main data we've got is the number of coronavirus cases picked up through testing.
This shows that, although London initially had the largest spike in cases in early April, northern England has had the highest sustained rates of infection since that point.
Strict restrictions in October, followed by the national lockdown, have helped drive down cases in the North - particularly the North West, but they still remain higher than in the South.
In the week ending 22 November, case rates were:
- North East 279 cases per 100,000
- North West 212 per 100,000
- Midlands 230 per 100,000
- South West 128 per 100,000
- South East 147 per 100,000
- London 165 per 100,000
Looking at these rates doesn't necessarily tell the full story though.
We know that some "hotspots" have received mass testing, for example and when you test more people, you are more likely to find cases - which could contribute to a rising rate.
However, other data sources do confirm a gap between the regions.
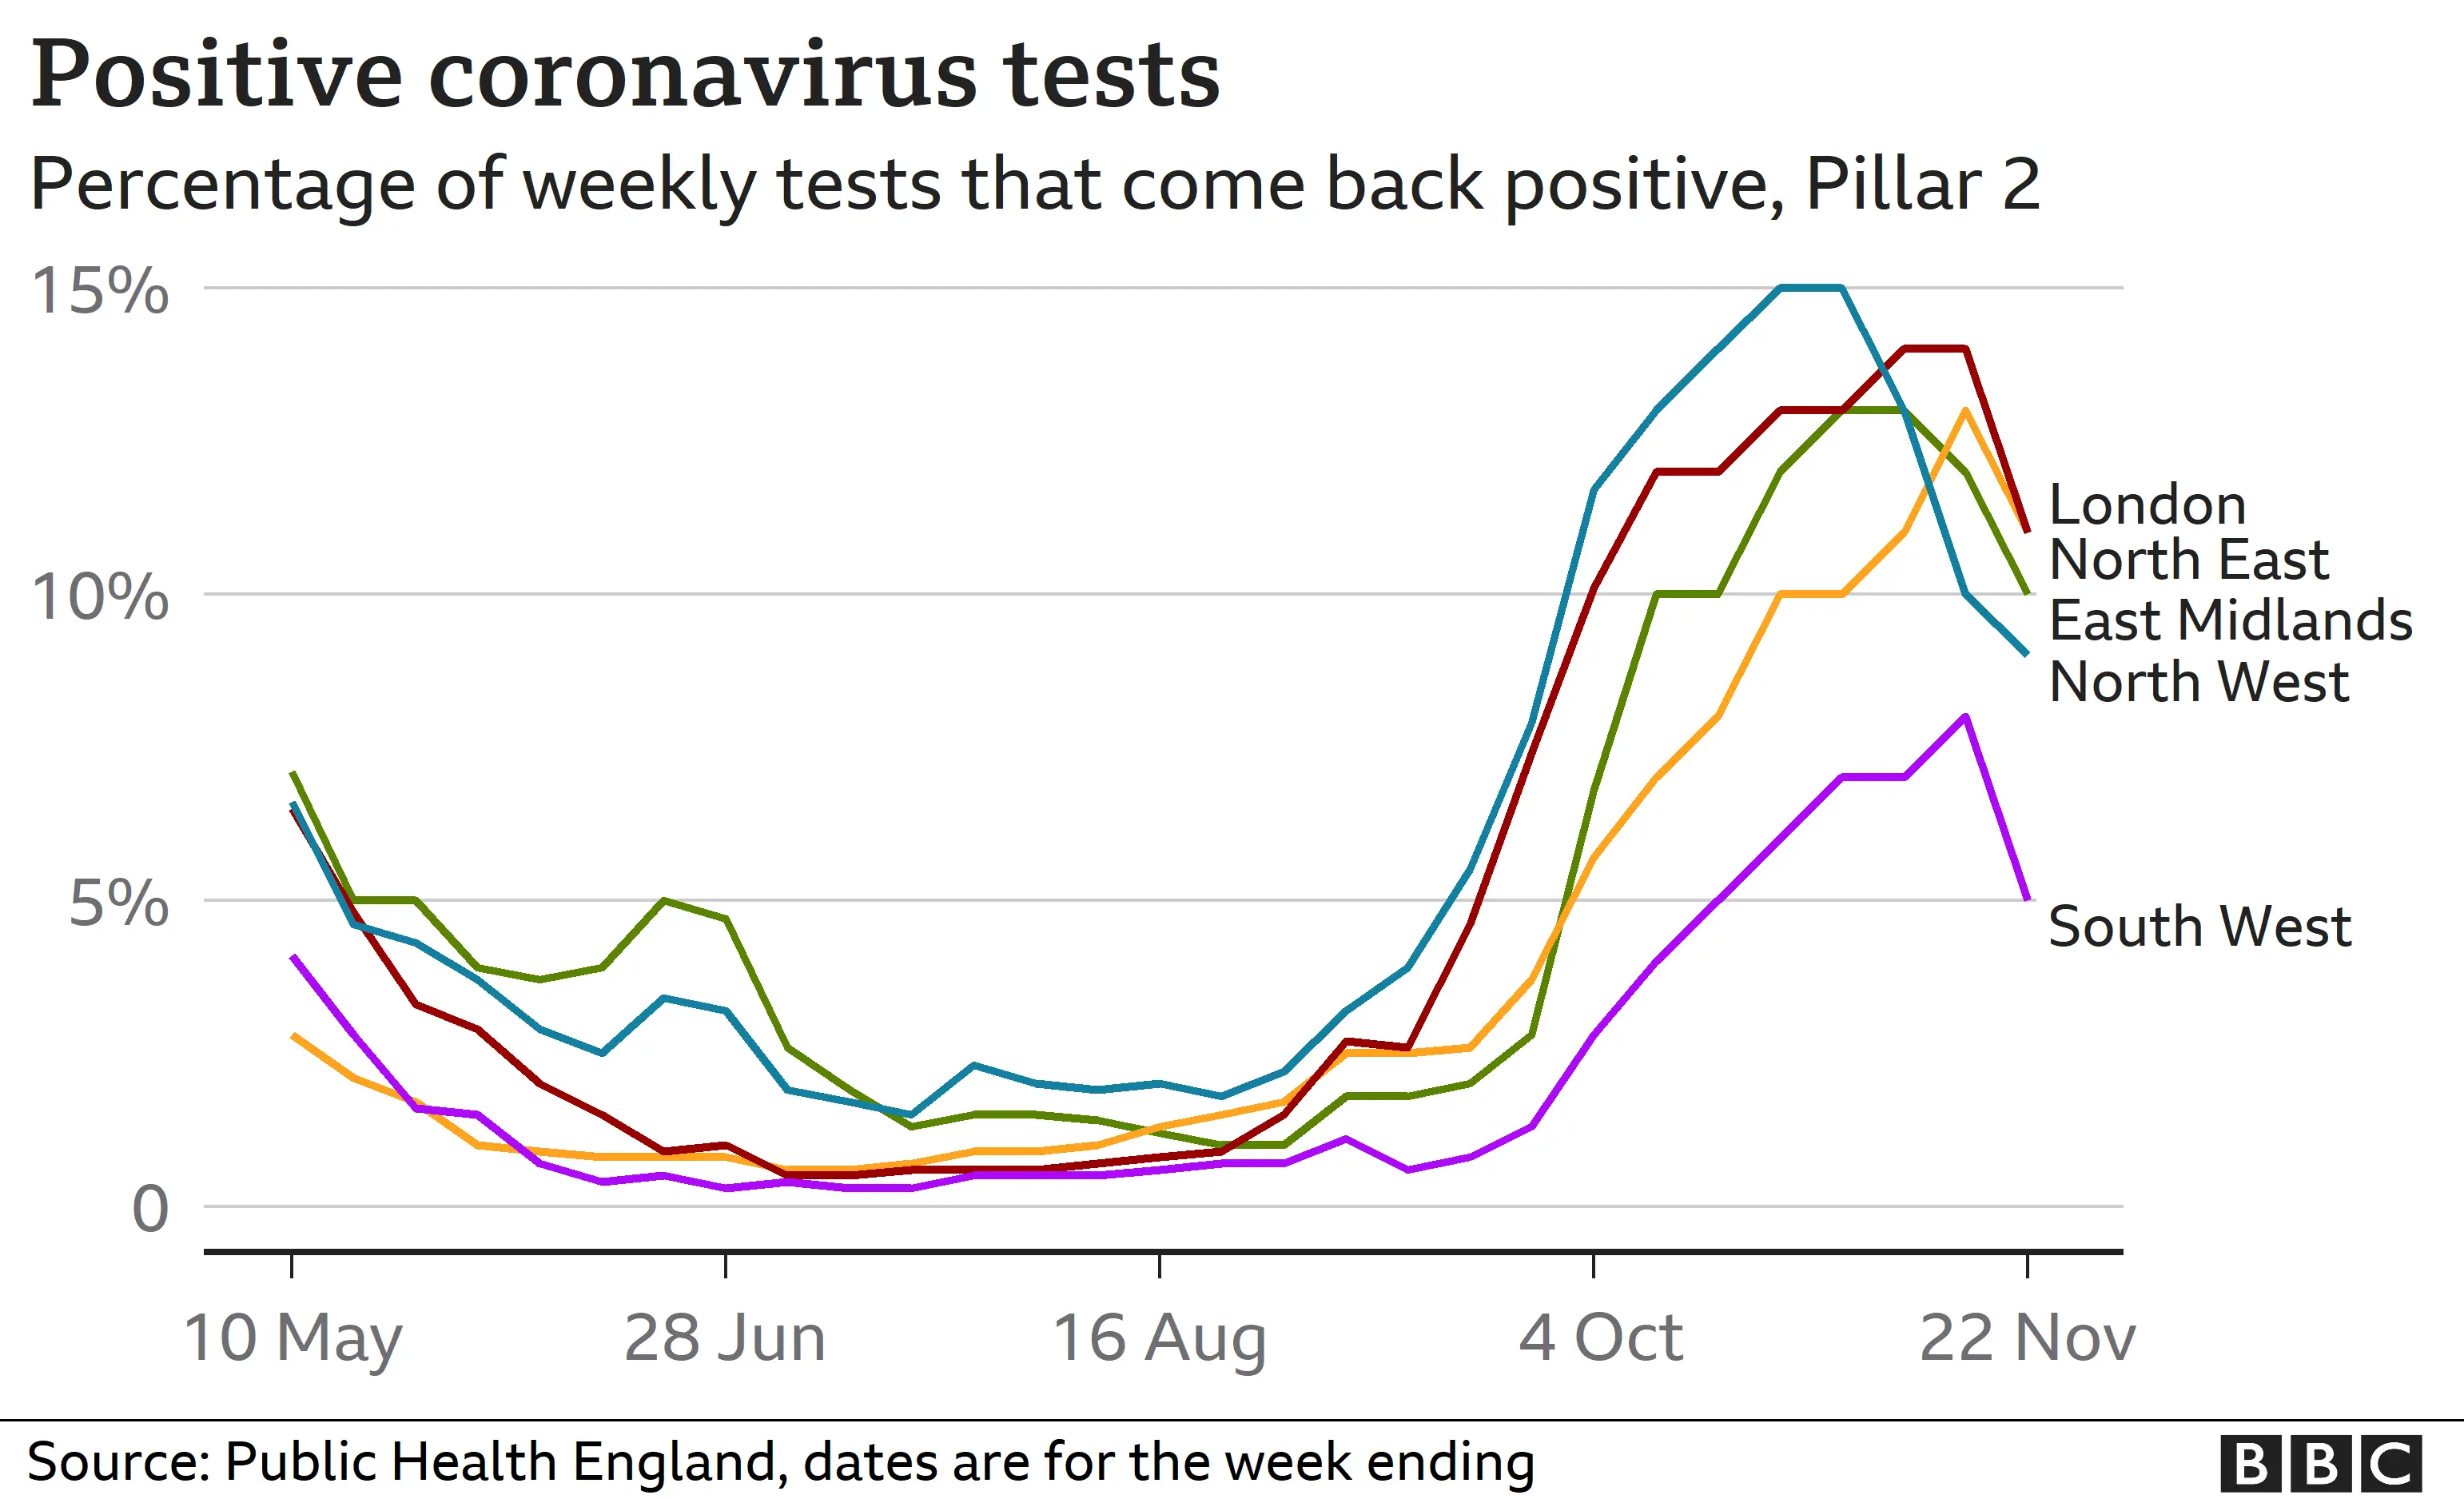
For example, the proportion of tests that prove positive increased across the country in October, and was highest in northern regions before coming down in recent weeks.
In North East England, about 10% of tests done on the public are coming back positive (double the figure of a month ago), while in the South East and South West, it is under 7%. In London, though, it is around 10%.

And the Office for National Statistics infection survey, which is used to get an estimate of coronavirus in the wider population who might not get a test, shows that samples taken in the North West, North East and Yorkshire are coming back positive at about twice the rate of the South.
The samples also show that London has high rates which are comparable with the north, something not picked up in the same way by the testing system's case rate.
Hospital admissions
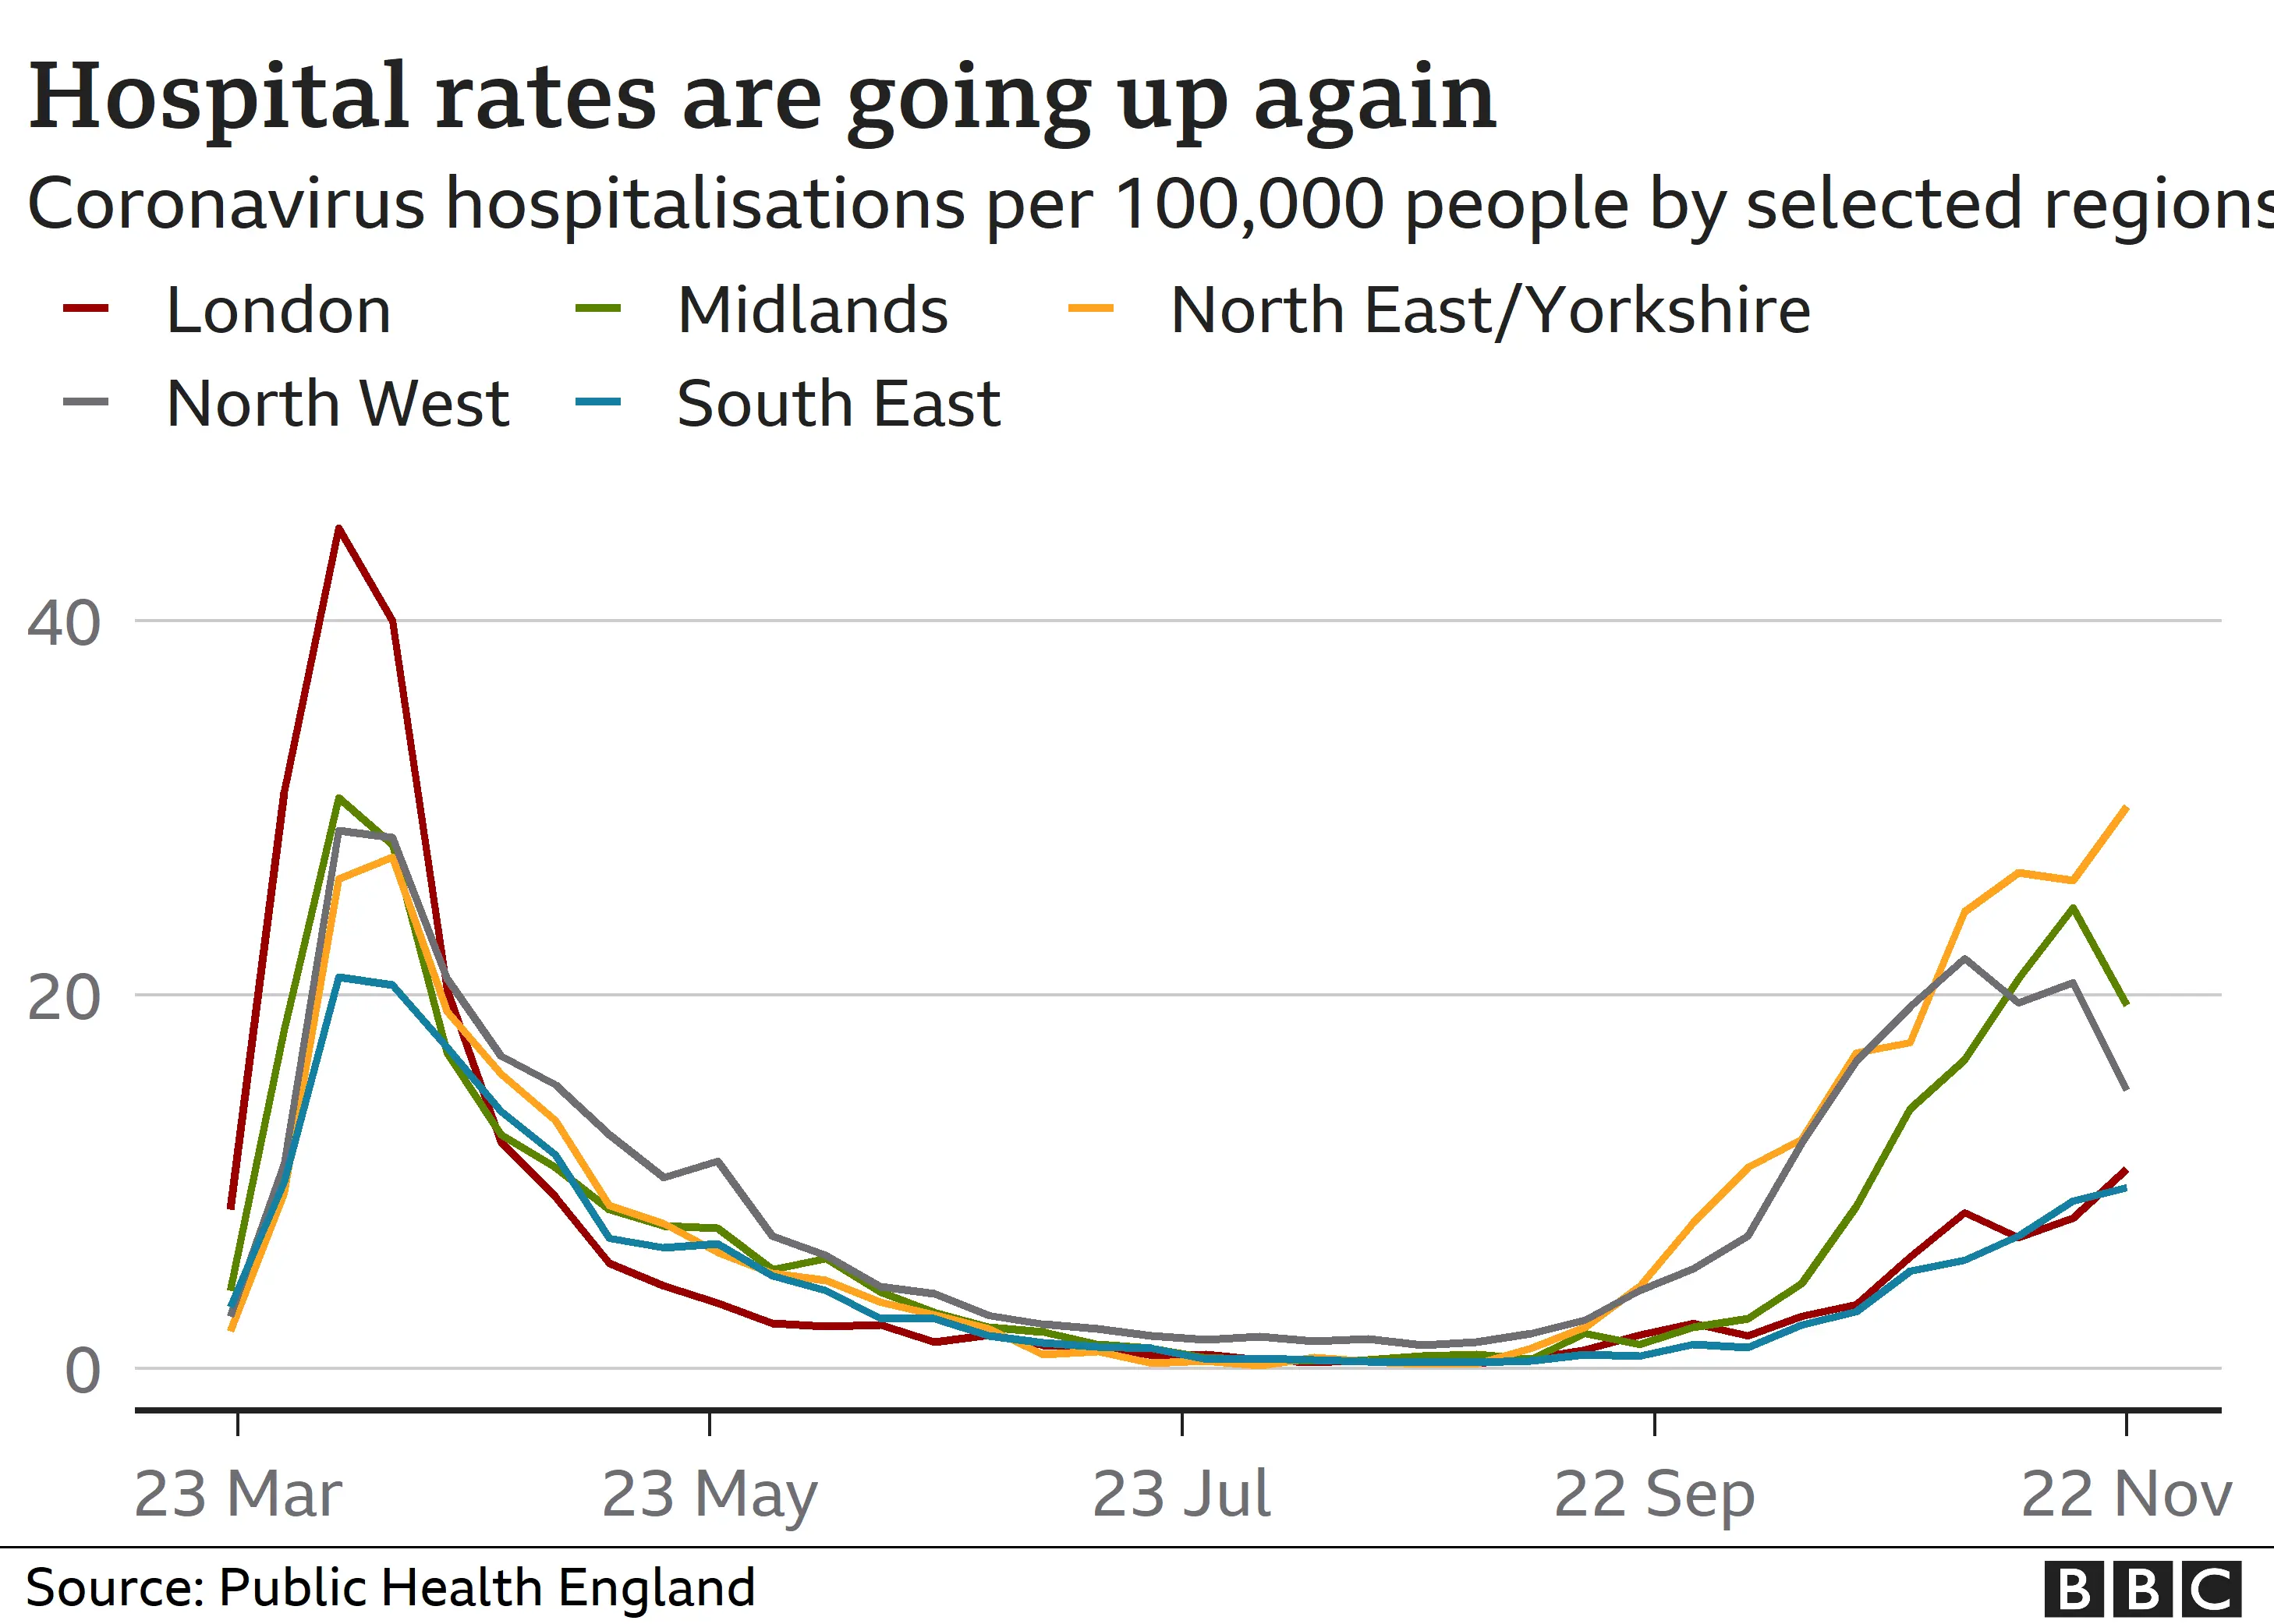
Hospitalisation rates of people with coronavirus for the week ending 22 November again show a regional variation:
- North East 30 per 100,000
- North West 14.3 per 100,000
- Midlands around 20 per 100,000
- London 10.7 per 100,000

How long has the North been under restrictions?
Some parts have been facing curbs for a very long time.
In Leicester, for example, it has been against the rules to go to a friend's house for dinner for more than eight months (there was a brief period when you could go to someone's garden).
It has been almost as long in part of Greater Manchester and Lancashire, whilst in most of the south people have faced the same restrictions for four-and-a-half months.

What about London?
London will go into tier 2 but some parts of the capital rank highly in some of the metrics being used to decide tiers, such as case rates and test positivity.
The government acknowledges that the situation in London is not "uniform", but says that "the situation in London [as a whole] has stabilised at a similar case rate and positivity to other parts of the country in Tier 2."
We don't have access to the exact information the government is using and there is no public data on hospital capacity (how much space there is for new patients). Pressure on the NHS is one of the key criteria used to decide which area goes in which tier.
However, the data we do have shows that London's overall case rate is closer to the lower levels of the South West and South East than it is to the northern regions, as are its hospital rates (although they decreasing at a slower rate).
But some individual boroughs - including outer London areas - do score highly on these same metrics. High coronavirus prevalence in one or two areas has been used to bring whole counties into tier three - Kent, for example - so why hasn't this happened in London?
 Getty Images
The government points to cases rising in all areas of Kent, even if they are currently lower than in some parts of London, and says that hospital admissions might need to be spread across the county. They do not reference this particular concern for hospital capacity in London saying bed occupancy remains below the spring peak.
But without access to all the government data, we can't give a full explanation.
Why is the North being affected more?
There is no single answer.
First, the increases which happened over the summer and autumn could be linked to the timing of the easing of restrictions in May.
At the time, the Mayor of Greater Manchester, Andy Burnham, described it as a "London-centric" approach, because many of the regions had not yet seen the decrease in deaths and cases experienced in the capital.
Second, there could be factors relating to demographics in northern England which have made people there particularly vulnerable to the virus.

- A SIMPLE GUIDE: How do I protect myself?
- AVOIDING CONTACT: The rules on self-isolation and exercise
- LOOK-UP TOOL: Check cases in your area
- STRESS: How to look after your mental health

Lesley Jones, Bury's head of public health, told Radio 4's PM programme there was "more vulnerability within our populations" with "higher levels of deprivation, more density, more people in exposed occupations".
Throughout the crisis, research from Public Health England (PHE) has highlighted that people living in deprived areas "have higher diagnosis rates and death rates than those living in less-deprived areas".
Deprivation is linked to serious health conditions and other issues such as overcrowded housing.
Our analysis shows that 63% of people living in the most deprived areas are living in tier three areas; twice the rate of the least deprived areas.
On population density, people in south-western and eastern England are more likely to live in rural areas or small rural towns. This means they are less likely to live in overcrowded housing, reducing the spread between households.
According to the 2011 Census, 35% of southerners (excluding London) lived in these areas, compared with 26% in the Midlands and 19% in the North.
The case of London makes it difficult to simply call it a North-South divide, Richard Harris, a professor in social geography at the University of Bristol, told Reality Check in June.
"It is not a North-South divide but an urban-lower-income v others divide, with those in lower-income jobs more exposed to the disease than those that are more easily able to adapt to home working and other means of isolation," he says.
The ability to work from home is also a factor.
According to the Office for National Statistics (ONS), "jobs based in workplaces in London and the South-East are much more likely to be possible to do from home compared with the rest of the UK".
It says this is probably because of a higher proportion of people working in professional occupations in the region.


